| Issue |
Ann. For. Sci.
Volume 66, Number 5, July-August 2009
|
|
|---|---|---|
| Article Number | 512 | |
| Number of page(s) | 13 | |
| DOI | https://doi.org/10.1051/forest/2009036 | |
| Published online | 09 July 2009 | |
Original article
Variations of plant and soil 87Sr/86Sr along the slopeof a tropical inselberg Variation des rapports 87Sr/86Sr dans les sols et les plantes d’un inselberg tropical
Anne Poszwa1,2*, Bruno Ferry3, Benoît Pollie1, Catherine Grimaldi4, Pierre Charles-Dominique5, Michel Loubet6 and Etienne Dambrine1
1 Biogéochimie des Écosystèmes Forestiers, INRA Nancy,
54280 Champenoux, France
2 LIMOS UMR 7137, UHP Faculté des sciences,
B.P. 239, 54506 Vandoeuvre les Nancy Cedex
3 ENGREF, 14 rue Girardet, CS 4216,
54042 Nancy Cedex, France
4 UMR Sol-Agronomie-Spatialisation,
INRA-ENSA 65 rue de Saint-Brieuc CS 84215, 35042, Rennes Cedex, France
5 Laboratoire d’écologie générale MNHN/URA 1183/CNRS,
4 av. du petit Château, 91800 Brunoy, France
6 Université P. Sabatier, UMR 5563,
38 rue des 36 Ponts, 31400 Toulouse, France
* Corresponding author: This email address is being protected from spambots. You need JavaScript enabled to view it.
Received: 30 July 2008
Accepted: 15 December 2008
• From the summit downslope a granitic inselberg in French Guiana, soils and vegetation evolve from bare granite covered by cyanobacteria, to a savannah-type vegetation on thin patchy sandy accumulations, then to a low forest on shallow young soils and to a high forest on deep highly weathered ultisols.
• We have used element budgets and Sr isotopic variations in soils and plants to investigate the mineral nutrient supply sources of the different plant communities.
• Granite and atmospheric deposition have 87Sr/86Sr ratios of 1.3 and 0.71, respectively. The 87Sr/86Sr ratio of cyanobacteria (0.72) suggests granite weathering by cyanobacteria crusts. The 87Sr/86Sr ratio of the savannah-type vegetation is 0.73 and varies between 0.75 and 0.76 in the low and high forest leaf litter regardless of soil depth, age and degree of impoverishment.
• These almost constant ratio suggest that forest Sr comes from rainwater and from the summit of this inselberg, where it is released and redistributed along the slope, by surface flow, lateral redistribution of litter, and mineral particles. However, because of its very low content in the rock and soils, Ca is supplied to plants by atmospheric deposition.
Résumé
• Du sommet vers la base d’un inselberg granitique (Nouragues, Guyane Française), les sols et la végétation évoluent depuis des savanes sur des ilots sableux entre les affleurements rocheux couverts de cyanobactéries, vers une forêt basse sur sols peu épais, riches en minéraux altérables puis une forêt haute sur sols très profonds et altérés.
• Les variations isotopiques du strontium des sols et des plantes ont été mesurées pour rechercher les sources de nutriments des différentes communautés végétales.
• Les rapports 87Sr/86Sr du granite et des dépôts atmosphériques sont respectivement de 1,3 et 0,71. Le rapport 87Sr/86Sr des cyanobacteries (0,72) suggère une libération de Sr par altération du granite. Le rapport 87Sr/86Sr de la savanne est de 0,73 et varie entre 0,75 et 0,76 dans les litières de forêt basse et haute, quelle que soit la profondeur, et la richesse en minéraux altérables des sols.
• La faiblesse et l’homogénéité surprenante de ces rapports suggèrent une alimentation en Sr des forêts essentiellement à partir de dépôts atmosphériques et des sols de la partie haute de l’inselberg, via des écoulements de surface, des redistributions latérales de litière et de particules minerales lors de crises érosives. Cependant, en raison de l’extrême pauvreté de la roche et des sols en calcium, le Ca des communautés végétales provient de la pluie.
Key words: inselberg / nutrient cycling / 87Sr/86Sr / tropical soil / rainforest
Mots clés : inselberg / cycle des nutriments / 87Sr/86Sr / sols tropicaux / rainforest
© INRA, EDP Sciences, 2009
1. INTRODUCTION
Two primary sources provide mineral nutrients to forested ecosystems: the atmosphere and soil mineral weathering. The sustainability of forest ecosystems depends on these primary fluxes, as well as on the efficiency of nutrient uptake and cycling within the ecosystems. Tropical rainforests at low elevations generally cover deep highly weathered acidic soils, extremely impoverished in nutrients. The common view is that plants take up most of their nutrient requirements from the upper horizons, recycling the elements released by litter decomposition (Jordan, 1982) and atmospheric deposition (Chadwick et al., 1999). But the possible contribution of erosion processes bringing fresh rock fragments or less impoverished soils horizons close to the surface has recently been stressed (Bern et al., 2005; Porder et al., 2005).
Inselbergs are large rock outcrops dominating tropical landscapes. The savanna-like vegetation associated to these landforms is rather uncommon in present tropical landscapes but was much more widespread during the Würm period (22000–13000 BP) and the shorter dry period of the Holocene (De Granville, 1982) especially in South America. The present persistence of savannahs is explained by large-scale forest fires which took place during the last few thousand years (Charles-Dominique et al., 1998) leading to forest opening and recurrent erosive crisis (Rosique et al., 2000). Thus, forests surrounding inselbergs are aggrading forests, tending to colonize inselberg slopes, where soil formation is initiated. Along the slope of inselbergs, soil depth, age and properties evolve gradually from bare rock patches and thin eroded soils at the summit to deep highly weathered soils in the high forest. These small scale variations in soil thickness and microclimatic conditions lead to an extreme variation in plant diversity (Burke, 2001; Larpin et al., 2000; Porembski and Barthlott, 2000; Sarthou and Villier, 1998), and offer a unique opportunity to study the contribution of rock and soil mineral weathering to plant nutrition.
Tracers, and especially isotopic tracers, are useful when the contribution of different sources to tree supply is to be established. Strontium (Sr) is not essential to the plant, but the chemical structures of calcium (Ca) and strontium are close and Sr concentrations correlate with Ca concentrations in stream waters and plant organs (Poszwa et al., 2000). In rocks, 87Sr derives from the natural radioactive decay of 87Rubidium (half-life 4.88 1010 y, Faure, 1986). Rubidium is abundant in minerals rich in potassium such as K-feldspar and biotite. The 86Sr isotope is non radiogenic and primarily found in minerals rich in Ca such as plagioclase and apatite. As a result, the 87Sr/86Sr ratio of the Sr released by mineral weathering is high in old rocks, which are rich in K and Rb and poor in Ca, such as granites. In comparison, the 87Sr/86Sr ratio of atmospheric deposition is low and close to the oceanic 87Sr/86Sr ratio (0.709). This difference has been used to quantify the relative contribution of atmospheric deposition and mineral weathering to base cation fluxes in various forested ecosystems (Åberg 1995; Bailey et al., 1996; Capo et al., 1998; Graustein, 1989; Graustein and Armstrong, 1983; Miller et al., 1993).
The strontium isotope method was applied in the Nouragues natural reserve in French Guiana, dominated by a large granitic inselberg. The ecology of this pristine area has been the focus of a large research program for many years (Bongers et al., 2001). In this study, the nutrient content and 87Sr/86Sr isotopic ratio of selected and representative plant leaves, bulk litters and soils along the slope of the inselberg were measured in order to compare the contributions of atmospheric deposition and weathering to the different plant communities. Our hypothesis was that the contribution of the rock to plant Sr and other nutrients would decrease progressively from the communities living on the shallow soils of the summit to the high forest on the lower part of the slope, as soils get deeper and more depleted in weatherable primary minerals.
2. MATERIALS AND METHODS
2.1. Study site
The study was carried out at the Nouragues Reserve research station (4° 3’ N, 52° 40’ W, French Guiana), 100 km west of the Atlantic coast, in the “Montagnes Balenfois” massif. The dense pristine tropical rainforest is dominated by an isolated and partly denuded granitic inselberg, which emerges from a plateau of deeply weathered metavolcanic rocks of the Paramaca formation (Choubert, 1974). The inselberg bedrock is a 1.9 to 2.1 Ga old “Caribbean” granite (Depagne and Lelong, 1965; Gruau et al., 1985). This rock is a pinkish monzonitic-type granite. The mineral content is 76% SiO2, 12.9% Al2O3, 0.7% FeO, 4–5% K2O, 3.8–4.2% Na2O, 0.12% MgO, 0.45% CaO, and 0.1% P2O5 (Sarthou and Grimaldi, 1992; this work). The major minerals are quartz, microcline and albite. Apatite and muscovite are accessory minerals. Average annual precipitation is 3000 mm with large inter-annual variations (range: 2500–4000 mm) (Boyé et al., 1979; Grimaldi and Riera, 2001). Rain occurs on average 280 d y−1, with two drier periods, one from September to October and a shorter one in March. The relative humidity is 20% in the dry season and 100% in the rainy season (Sarthou and Grimaldi, 1992) and the average daily temperature is 25–27 °C. However, the temperature of bare rock surfaces may vary widely (18–55 °C) diurnally (Rascher et al., 2003; Sarthou and Grimaldi, 1992), because of the dark cyanobacteria covering these surfaces.
The inselberg is dome-shaped and elongated along the SE-NW axis. From the top of the inselberg, the landscape is composed of four main units (Fig. 1a):
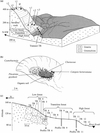 |
Figure 1 Nouragues site. (a) General view of relief, vegetation units and sampling locations on the Nouragues inselberg; (b) Savannah rock main vegetation sampling locations on depressions at the summit of the inselberg and on the high terrace; (c) Soil and litter sampling locations on the transect (TR) from the high terrace to the basis of the inselberg. |
The “rock-savannah” unit (Sarthou, 1992) extends from thesummit (411 m) to the high terrace (200–140 m). The relief of thisunit is a smooth pattern of domes and small depressions, formingelementary micro-catchments, each of them up to several hundredsquare meters in size. The bare rock is covered by a black continu-ous crust of cyanobacteria. Species include (Rascher et al., 2003;Sarthou et al., 1995): Scytonema guyanense, S. multiramosum, S.myochrous, Stigonema flexuosum, S. hormoïdes, S. ocellatum, S. panniforme, Hapalosiphon fontinalis, H. luteolu and Gloeocapsasanguainea, most of which are nitrogen fixers (Dojani et al., 2007).The endolithic cyanobacteria Choococcidiopsis sp. (Rascher et al., 2003) penetrate the granitic surface to 1–5 mm in depth. Smalldepressed areas are occupied by dense patches of Bromeliaceaemats of varying size, mainly represented by Pitcairnia geyskesii andshrubs of Clusiaceae (Clusia minor and C. nemorosa) and Myrtaceae(Myrcia saxatilis and M guyanensis…) (Sarthou andVilliers, 1998). Black organic cyanobacteria residues generallyaccumulate at the upper edge of these patches (Vaçulik et al., 2004).The soils are very thin and acidic (pH 4–5.5), formed by Pitcairnia andClusiacea litter accumulation over sandy accumulations (0–20 cmthick). During rain events, waters running on bare rocks downslopefrom these patches are especially enriched in K and N compared torainwater (Sarthou and Grimaldi, 1992; Dojani et al., 2007).
the low forest (tree height up to 8–15 m) extends between the rocksavannah and the high forest, as a continuous belt less than 100 m wide,from an elevation of 140 down to 120 m. It also occurs as isolated in-clusions within the high forest and the rock savannah, for example onthe northeastern flank close to the summit (Fig. 1a). The main canopyspecies are Eriotheca surinamensis (Bombacaceae) and large in-dividuals of Clusia minor. The understory vegetation is composedof the herb Stelestylis surinamensis, numerous epiphytes, as well asshrubs and small trees predominantly belonging to the Rubiaceae,Myrsinaceae and Nyctaginaceae families. Close to the summit,soils below the low forest are very shallow and vary from sandy tosandy-clay colluvium. On the slope, yellowish brown sandy clayedsoils with many weathered granite boulders develop below the lowforest.
The low forest evolves downslope through a transition forest (> 15 m height) to a high forest (height > 30 m) on slopes above the river Nouragues. In the transition forest, many species, which have a multi-stemmed habit in the low forest, show tall and vertical stems. Some species typical of the high forest occur, but typical features of the low forest, like the abundance of herbs, persist. Downslope, in the high forest, only 25% of the low forest species are still found. The total number of tree species is 550, and includes 63 families (Poncy et al., 2001). Eschweilera coriacea, Vouacapoua americana and Eperua falcata are the most abundant. Soils below the transition and high forest are red ultisols, more than 3 m deep, depleted in base cations (pH 4.1–4.8).
On the other side of the Kwak river, the Grand Plateau (GP) is covered by a pristine high forest. Soils derived from metavolcanic rocks are thick reddish ultisols extremely rich in Al-Fe nodules (Grimaldi and Riéra, 2001).
2.2. Sampling
The field work was conducted during the dry season, in October 1999. We sampled cyanobacteria crusts on bare rock edges (Fig. 1b) in three small depressions (i.1, i.2, i.3) at the summit of the inselberg (at about 400 m), and three others (t.1, t.2, t.3) on the high terrace (200–140 m), where the typical savannah-rock vegetation was present. Rain supplies water directly to the cyanobacteria on the summit of the inselberg whereas the cyanobacteria located on the high terrace may also receive a fraction of the surface flow draining along rock gullies throughout the savannah-rock vegetation unit. Leaves from different plants of Pitcairnia geyskesii were collected in the small depressions. Leaves of Clusiaceae, downstream of Pitcairnia mats, were sampled, all around shrubby thickets. Leaves of some epiphytes (Catopsis berteroniana) growing on the Clusiaceae were also sampled. In each depression, mineral soils associated with Pitcairnia mats and organic soils under Clusiaceae were sampled.
Because of the high plant diversity, we collected composite samples (100 g) of fresh leaf litter from the soil surface, within circular areas ten meters in diameter. Two leaf litter samples were collected within a patch of low forest (IF) on the North Eastern summit of the inselberg. From the upper limit of the high terrace, at an elevation of 140 m, leaf litter was sampled along a several NW-SE transects (TR, Fig 1a) below the low forest (TR1 to TR6), below the transition forest (TR7 to TR10) and below the high forest, (TR11 to TR13) down to the bank of the Kwak river (TR13). In addition, leaf litter was sampled on the other side of the Kwak river, below the high forest growing on thick ultisols developed from metavolcanic rocks (site GP).
Below each type of forest, we dug and described characteristic soil profiles at the centre of some of the circular areas where leaf litter were collected (see Fig. 1c). The stone content was visually assessed in each profile. Soil bulk density was not measured. To estimate exchangeable and total element stores in the fine earth, we assumed density values from 1 in surface horizons to 1.4 at depth. On the northeastern summit of the inselberg, at site IF, in a deep bleached sandy colluvium where the groundwater level rises close to the soil surface in the rain season, soils were sampled per horizon, down to 1.80 m; after sieving, fine roots (< 2 mm) were separated from the bulk soil at each depth. Small patches of soils between boulders in the low forest transect were not sampled. Down the slope, granite boulders progressively disappear from the ground surface, as the transition forest appears. In the lower part of the low forest (profile TR6), soils were sampled per horizon, down to the weathered bedrock (80 cm), sieved in the field and fine roots (diameter smaller than 2 mm) were separated. Between 120 and 100 m, below the high forest, soils were also sampled at two sites (TR9 and TR11) with an auger down to 280 cm (granite was not met at this depth). One soil sample (10–20 cm) from site GP (on metavolcanic rocks) was also taken. Three rock samples were taken. From the summit of the inselberg, two fragments of granite were broken from large solid isolated boulders, and we sampled the heart of these fragments. From Profile TR6, on the slope, a piece of weathered granite boulder was taken at –80 cm depth. One rainwater, one gully-water and two groundwater (from pit IF) samples were collected at the summit of the inselberg. Seven water samples, all of them draining the granitic inselberg, were taken from the main river Nouragues, from several springs in the high forest, and from a tributary of the Kwak river.
2.3. Soils and vegetation analysis
Soil texture, pH, carbon (C), nitrogen (N) and C/N ratio were determined by conventional methods. Soil exchangeable base cations from all soil samples were extracted by two sequential extractions of 10 g of soil (< 2 mm) in 50 mL 1 M NH4Cl. Aliquots of the fine earth (< 2 mm) from the major horizons and bulk rock samples were ground in an agate mortar. Mineralogy of the fine earth was assessed for all soil horizons by X-ray diffraction. In addition, minor mineral phases enriched in Sr, were investigated in the granite and in several soil horizons using a scanning electron microscope (SEM) coupled to an energy dispersive spectrometer (EDS). Ground samples from selected horizons of profiles IF, TR6 and TR11 (Tab. I), were digested overnight with 1 mL of HNO3 purified by double distillation and 1 mL of high purity HF. After evaporation, to ensure total digestion of the samples we added a few drops of HClO4and H2O2, to remove Ca fluorides and organic mater residues. Cyanobacterial crusts were carefully detached from bare rock surfaces and adhering mineral grains were removed using a paintbrush under a magnifying glass. The fine roots collected in profiles IF and TR 6 were cleaned of soil particles using ultra pure water, and a paintbrush. Roots, cyanobacteria, Bromeliaceae, Clusiaceae and epiphyte leaves as well as leaf litter samples were dried at 65 °C in an oven, then finely ground. The total digestion of 0.5 g of each sample was performed in 10 mL of high purity HNO3 (Merk suprapur, 65%), in a digestion block system (Tecator 40 1016).
Total and exchangeable element concentrations in profiles IF, TR6 and TR11.
Calcium, Sr, Mg, P, and K in vegetation samples; Ca, Sr, Mg, K, Al, and Mn in soil NH4Cl extracts; and Ca, Sr, Mg, K, and Si in rain and river samples were analysed by ICP AES. Major and trace element contents of rock and soil samples were measured after acid digestion by ICP-MS. For isotopic measurements, aliquots of samples in solution (NH4Cl extract, water, rock, plant and soil digest by HNO3) containing about 500 ng of Sr, were evaporated, treated with high purity HNO3 and H2O2 in order to remove organic matter remains, then evaporated to a solid in Teflon beakers. Samples were then dissolved with HCl 2 M and passed through quartz glass ion exchange columns containing 8 mL of a Temex 50WX8, 200–400 mesh resin. Strontium was collected after sequential elution with 2 M and 4 M HCl and evaporation. Strontium contents in chemical blanks were lower than 2 ng. The 87Sr/86Sr isotopic ratio of samples was measured by mass spectrometry (Finnigan Mat MS 261). NBS 987 standard was used to control and standardize the measurements. Measurement accuracy was always below 2× 10− 5.
2.4. Determination of element losses by mineralweathering
Element losses during the process of rock weathering and soil formation are usually calculated using a conservative tracer, which is least affected by dissolution and leaching processes, such as titanium (Aubert et al., 2001), zirconium (Bain and Bacon, 1994; Hodson, 2002), thorium (Braun et al., 1993) or niobium (Porder et al., 2006). The more immobile the element, the more its concentration increases from the parent material to the soil surface. Titanium (Ti) concentration was found to increase more than zirconium, nobium and thorium in these soils, and therefore was used to estimate mineral element losses by weathering from the granitic rock. Assuming the only source of element X in the bulk soil is the rock, the proportion of this element XTi (in reference to Ti) originating from the rock at a given soil depth was computed as :

3. RESULTS
3.1. Soil and stream water composition
Soils developed in small depressions in the savannah-rock unit were thin (5–20 cm) bleached sandy layers, rich in organic carbon (5 to 50%). The cation exchangeable capacity (5–100 mmol(+) kg−1) and the sum of exchangeable base cations were strongly correlated with the total C content (Sarthou and Grimaldi, 1992). Base saturation was below 30% (Sarthou and Grimaldi, 1992). Below forest, soil textures varied from sandy-clay (up to 70% sand) in TR6 (low and transition forest) to clayey-sand (up to 50% clay) in TR9 and TR11, in the high forest. The silt fraction was always below 10% (Grimaldi and Riera, 2001). The profile IF contained about 20% gravels (< 1 cm) down to 150 cm depth but gravels were absent from the deeper sandy layer. The stone content at TR6 was about 50 % at 80 cm and between 30% and 15% in upper horizons. No stone was observed at TR11. The C content of the upper layer (0–5 cm) decreased from 5% in TR6 (transition forest) to 3% in the high forest. Soil pH increased from 4.2 in upper horizons to 5 in deep horizons. The cation exchangeable capacity was about 10 mmol (+) kg−1 in upper horizons. Base saturation decreased sharply at depth, except in the weathered granite from the deepest horizon in profile TR6 (Tab. I). Relative to the C content, the base saturation in the upper soil layer (0–10 cm) decreased along the slope to the high forest (Fig. 2).
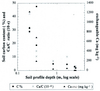 |
Figure 2 Soil total carbon content and exchangeable Ca concentration in the horizons 0–10 cm in relation to the total depth of soil profiles. |
From the granite to the topsoil of profile TR6, titanium concentration increased from 0.6 mg g−1 to 3.5 mg g−1. Titanium concentrations in the topsoil horizons of profiles IF (3 mg g−1), TR6 and TR11 (3.5 mg g−1) were in the same range. The total Ca concentration decreased drastically from the granite (2.8 mg g−1) and the weathered granite (2 mg g−1) to the topsoil horizons of all profiles (from 0.16 mg g−1 in TR6 to 0.05 mg g−1 in IF). Sodium concentration decreased even more, from 13.95 mg g−1 to 0.26 mg g−1 at TR6 and below 0.1 mg g−1 in the other profiles. Contrastingly, Sr concentration decreased much less, from 24 μg g−1 in the granite to 14, 10.5 and 9.2 μg g−1 in the topsoil of TR6, IF and TR11 respectively (Tab. I). In TR6, K, Ba and Rb concentrations decreased from the bottom to the top in parallel to Sr. But the concentrations of K, Ba and Rb in surface horizons of the deeply weathered profiles IF and TR11 were almost ten times lower than in TR6. The proportions of Ca and K in soil profiles IF, TR6 and TR11, in reference to Ti, are illustrated in Figures 3a, 4a and 5a, respectively. Less than 1% of the Ca and Na from the initial rock content remained in the upper soil horizons at all sites, while about 10% of the rock original Sr content was preserved.
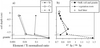 |
Figure 3 Soil profile IF. (a) Proportion of Ca, Sr, and K remaining after weathering and dissolution according to soil depth; (b) 87Sr/86Sr isotopic ratio of granite, bulk soil and roots according to depth. |
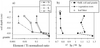 |
Figure 4 Soil profile TR6. (a) Proportion of Ca, Sr, K and Na remaining after weathering and dissolution according to soil depth; (b) 87Sr/86Sr isotopic ratio of granite, bulk soil and roots according to depth. |
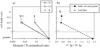 |
Figure 5 Soil profile TR11. (a) Proportion of Ca, Sr, and K remaining after weathering and dissolution according to soil depth; (b) 87Sr/86Sr isotopic ratio of granite, bulk soil and roots according to depth. |
From X-ray diffraction patterns we identified in the granite quartz, albite, and microcline as well as low amounts of muscovite. The sample used as reference contained low amounts of gibbsite and kaolinite, showing incipient weathering. Apatite was not identified but could be deduced from the total rock content in P. In profile TR6, quartz (4.25 Å and 3.34 Å), gibbsite (4.84 Å), minerals of the kaolinite/halloysite group (large peaks around 7.20 Å and 3.58 Å) and microcline (4.22 Å and 3.25 Å) were the main minerals. Muscovite (10 Å) was present in the weathered rock and in the fine earth of the deepest horizon. It disappeared in the 30–50 cm layer and was again present (but with a low intensity) in 0–10 and 10–20 cm layers. Albite was present in the deepest horizon (4.03 Å and 3.19 Å) but disappeared higher in the profile. In shallow sandy soils below Pitcairnia patches, minerals were quartz, microcline and albite, while the mica component was almost absent. In the sandy colluvium of profile IF, the main remaining mineral was quartz, with low amounts of gibbsite, and microcline especially in the topsoil, while albite was almost absent. In profile TR11, the main minerals were halloysite, gibbsite and quartz, with small amounts of microcline in the upper horizon (10–20 cm). Small amounts of albite and microcline were present as well in this deepest horizon sampled (220–280 cm), the texture of which was sandy. The upper horizon of profile GP, on metavolcanic rocks, was composed of aluminous goethite (peaks at 4.12 Å, 2.65 Å and 1.69 Å), gibbsite and minerals of the kaolinite-halloysite family, with quartz but no other primary minerals.
Along the river Kwak and upstream waters draining the slope of the inselberg, Ca (1–3.5 μmol L−1), K (2.3–15.6 μmol L−1), Sr (0.0007–0.0045 μmol L−1) and Si (40–97 μmol L−1) concentrations were very low and Sr was best correlated to K (r = 0.93). Groundwater from IF as well as gully water samples collected at the summit of the inselberg have concentrations generally close to rainwater (Négrel and Lachassagne, 1997) but much higher concentrations in K and NO 3, as already observed by Sarthou and Grimaldi (1992).
3.2. Element concentrations in vegetation samples
Ca and Sr are poorly translocated in plants (Marschner, 1995), so that leaf and litter concentrations are approximately similar. The highest Ca and Sr concentrations (Tab. II) were measured in Clusiaceae leaves, and in leaf litter from the low forest on the upper part of the transect (greater than 5 mg g−1 and 50 μg g−1, respectively). Calcium and Sr concentrations of litter from intermediate and high rainforest trees on granite were less than 5 mg g−1 and 50 μg g−1, respectively. Lower Ca and Sr concentrations were found in Pitcairnia and Catopsis leaves, and especially in cyanobacterial crusts (0.5 mg g−1 and 6.3 μg g−1respectively). The lowest Sr concentrations (4.4 μg g−1) were measured in epiphyte leaves. Strontium and Ca concentrations were well correlated in plant leaves, forest leaf litters and forest fine roots for the whole site (r = 0.93, Fig. 6). Potassium concentrations in Pitcairnia leaves were generally higher than in Clusiaceae leaves (9–12 mg g−1) , whatever the sampling site, and much higher than in other plant leaves and cyanobacteria crusts (below 4.3 mg g−1). Phosphorus concentrations in Pitcairnia leaves (0.4–0.5 mg g−1) were generally higher than in Clusiaceae leaves (0.3–0.35 mg g−1), with slightly higher contents on the high terraces than on the summit of the inselberg. Leaves of the epiphyte Catopsis had lower P content (0.25 mg g−1) than leaves of Clusiaceaeon the stem of which they develop. Phosphorus and K contents in leaves from the savannah-rock unit and leaf litters from the forest cannot be directly compared because of internal translocation before leaf senescence. In leaf litters, P concentrations (0.1–0.2 mg g −1) increase from the low forest (inselberg and transect) to the intermediate and then to the high forest.
Strontium, Ca, K, P concentrations and 87Sr/86Sr isotopic ratio in leaves and leaf litters of the different plant species sampled on the Nouragues site.
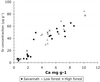 |
Figure 6 Correlation between Ca and Sr concentrations in the different plant organs sampled on the Nouragues site (savannah, low and high forest). |
3.3. 87Sr/86Sr variations in soils and plants
The Sr isotopic ratios of the two granite samples taken at the summit were 1.275 and 1.374 respectively. In profile TR6, the 87Sr/86Sr ratio of the bulk soil varies between 1.04 and 1.14 from the weathered granite to the topsoil (Fig. 4b and Tab. I). In the bleached sandy colluvium of profile IF, bulk soil 87Sr/86Sr decreases from 0.87 in the deepest horizon (150–180 cm) to 0.76 close to the soil surface (Fig. 3b). In the thick profile TR11 below the high forest, the Sr isotopic signature of the bulk soils is 0.78 between 0 and 60 cm depth (Fig. 5b). Considering all soil samples, bulk soil 87Sr/86Sr ratio increases with K (or Rb) concentrations.
At the summit of the inselberg, the Sr isotopic ratio of cyanobacteria crusts (i1, i2) attached to hard rock surfaces varied from 0.723 to 0.729. The Sr isotopic ratio of Pitcairnia (0.723 to 0.724) and Clusiaceae (0.728 to 0.730) leaves growing in the small depressions varied in the same range as that of the cyanobacteria (Tab. II). The Sr isotopic ratio of leaf samples of the epiphyte Catopsis, growing on upper branches of Clusia shrubs and collecting rain water was in the same range but slightly lower (0.720–0.722). The 87Sr/86Sr of Pitcairnia and Clusiaceae collected on the high terrace (t1, t2, t3) was higher and more variable (0.728 to 0.753) than on the summit. Below the low forest patch close to the summit (IF), the Sr isotopic ratio measured in leaf litters were 0.747 and 0.756 .An intermediate 87Sr/86Sr ratio (0.752) was measured in leaves of Vriesea splendens, a Bromeliaceae growing on the soil surface in the same area. The Sr isotopic ratio of fine roots in the IF profile increased from 0.742 at 10 cm to 0.885 at 150 cm depth, but decreased to 0.764 at 160–180 cm (Fig. 3b).
At TR6, the litter 87Sr/86Sr ratio is 0.762. Fine root87Sr/86Sr ratio increasesd from 0.761 in the upper layer to 0.769 at 70 cm, then more sharply to 0.803 in the weathered granite (Fig. 4b). On the inselberg slope, from the high terrace to the valley, the Sr isotopic ratio in leaf litter is between 0.757 and 0.764 (Tab. II), regardless of site, forest type (low or high) and soil thickness. We did not measure the Kwak river 87Sr/86Sr ratio but it may be close to that of the litter collected from trees growing along the bank (0.758).
4. DISCUSSION
Plant 87Sr/86Sr ratio varied along the slope within a rather narrow range of values, much closer to rain than to granite87Sr/86Sr ratio. In order to explain this, we first discuss the fluxes and pools of mineral elements, then we suggest isotopic ratio values for the atmosphere and weathering end members in relation to rock and soil composition, and finally we propose a set of possible mechanisms.
4.1. Fluxes of Sr and Ca at the Nouragues site
At Cayenne in French Guiana, close to the seashore, Négrel et al. (1997) reported a volume weighted average Ca concentration of 15.3 μmol L−1 in precipitation during the dry season, which provided 11% of the annual precipitation, and 8.2 μmol L−1 for the whole year. The annual Ca deposition was 148 mol ha−1. These Ca concentrations are probably overestimated for our site as Ca (and Sr) concentrations decrease inland as a function of distance to the ocean (Meybeck, 1986). In fact, in the Maroni catchment (200–300 km inland from the coast), Négrel and Lachassagne (2000) measured an average Sr concentration in rain of 0.017 μmol L−1 and Ca concentration of 7.5 μmol L−1 during the dry season. Multiplying these concentrations by the mean annual precipitation (3000 mm) at our site leads to a deposition flux of 225 mol ha−1 of Ca, and 510 mmol ha−1 of Sr. A probably better estimate, which takes into account the lower concentrations of rains during the rain season compared to the dry season could be obtained by multiplying the deposition fluxes, calculated above for the Maroni catchment, by the ratio of Ca concentration between the wet and the dry season at Cayenne reported by Négrel et al. (1997) (8.2/15.3). This leads to annual deposition rates of 120 mol ha−1 (4.8 kg ha−1 y−1) of Ca, and 273 mmol ha−1 (24 g ha−1) of Sr. In comparison, in the Osa peninsula on the Pacific coast of Costa Rica, Bern et al. (2005) measured an annual Sr deposition of 135 mmol ha−1 y−1. In this study, we measured Sr concentrations of 0.0042 and 0.0026 μmol L−1 during two rain events in the dry season at Nouragues which suggests that the fluxes calculated above may be overestimated.
The calculated exchangeable Sr pools in the upper 60 cm of profiles IF, TR6 and TR11 are about 590, 420 and 180 g ha−1 respectively, and exchangeable Ca stores are about 50, 30 and 20 kg ha−1. The annual fine litterfall in the high forest is estimated to be 7 tons ha−1 y−1, based on values measured at Piste Sainte Elie (French Guiana), near the coast, by Puig and Delobelle (1988) and from a forest biomass inventory at Nouragues (Chave et al., 2001) combined with relationships between forest biomass and litterfall in tropical forests compiled by Clarke et al. (2001). Using this value and average litter concentrations measured in the transition and high forest, we computed an annual Sr and Ca cycling in litterfall of 320 g Sr ha−1 and 34 kg Ca ha−1 respectively. No values are available for the low forest, but litterfall is probably less. Hence, the exchangeable Sr pool is about 7–25 times the annual atmospheric deposition rate, exchangeable soil Ca is about 5–10 times the annual deposition rate, but annual Sr and Ca fluxes in litterfall (at least in the high forest) are in the same range as exchangeable pools in the upper 60 cm of the soils.
Strontium concentrations in drainage waters are lower than the rain concentrations measured by Négrel and Lachassagne (2000). Even if these streams only collect a fraction of the water draining the inselberg, the low Sr concentration suggests a continuous build-up of Sr stores in the vegetation, as soil exchangeable Sr pools are very low, and implies a low rate of Sr release by weathering.
4.2. Isotopic ratio of the atmospheric deposition and mineral weathering end-members
Measuring the mean Sr isotopic ratio of atmospheric deposition is complicated because of the inter-rainfall event variations of this ratio, the deposition of mineral dust with a different ratio (Grousset et al., 1992), and the risk of contamination by locally produced dust or animals. In French Guiana, Négrel and Lachassagne (2000) measured an average Sr isotopic ratio of 0.7118 in individual rain events during the dry period in the Maroni catchment, the highest ratio being 0.7149. In western Costa Rica (Bern et al., 2005) and in Hawaii (Chadwick et al., 1999), the Sr isotopic ratio of rain events was close to the seawater ratio (0.709). In Hawaii, deposition of dust from Asia (Nakai et al., 1993) with a Sr isotopic ratio of 0.718, contributed up of 3% of the total Sr load deposited from the atmosphere (Kennedy et al., 1998). Swap et al. (1992) showed that North African dust is the main source of dust to the Atlantic and the Central Amazon Basin. Grousset et al. (1992) measured a Sr isotopic ratio for North African dust of 0.716. Unfortunately, the relative contribution of dust to Sr deposition on the Amazon is unknown. At Nouragues, taking into account that the rainy season provides 80% of annual precipitation and are mostly of oceanic origin, we may hypothesize an annual average Sr isotopic ratio of 0.710. In order to provide an integrated value of the 87Sr/86Sr ratio in atmospheric deposition, we sampled the epiphyte Catopsis growing on upper branches of clusia leaves, because this plant has no functional roots and looks like a rain gauge, accumulating rain in its leaves. But this carnivorous plant use this water reservoir to attract insects which are used as a source of nutrients. We believe that the high 87Sr/86Sr ratio obtained (0.721), which is close to the ratio of plants in the savannah-rock unit, reflects mostly the contamination of the water reservoir by insects, as well as frogs and birds, which use it as a source of water. Finally, owing to the elevated age, stable position and extreme depletion of soils of the Grand Plateau on metavolcanic rocks, we had sampled recently fallen leaf litter with the idea that it might yield an upper estimate for the atmospheric deposition isotopic ratio. But the value obtained (87Sr / 86Sr = 0.713) may still be influenced by soil sources of Sr although it was close to that (0.714) measured by Poszwa et al. (2002) in trees growing on sandy quartzitic patches near the Atlantic coast.
In the wet and warm climate of the tropics, most granite minerals such as feldspar and mica are dissolved and clay minerals such as gibbsite and kaolinite/halloysite precipitate (Tardy, 1993). Even quartz is dissolved, but its dissolution rate is about two orders of magnitude lower than that of K feldspar (White and Brantley, 1995). A few accessory minerals, containing Ti (ilmenite, rutile) or Zr (zircon), resist dissolution. In granite, a fraction of the Sr may be located in Ca-rich minerals such as plagioclase and apatite, with another fraction in K-rich minerals with a higher 87Sr/86Sr ratio like microcline and muscovite. Compared to feldspar, the Sr isotopic ratio of mica is very high, but its content in Sr is very low (Aubert et al., 2001; Clow et al., 1997; Probst et al., 2001), and especially that of muscovite. Muscovite is weathered in the deep horizon at TR6 and is absent from the other profiles. Therefore, its contribution to the Sr isotopic ratio of soils and to Sr release by weathering is most likely weak.
The Sr isotopic ratio of the solid granite sample (87Sr/86Sr ratio = 1.27) collected at the summit of the inselberg is higher than that of the weathered granite sample (87Sr/86Sr ratio = 1.04) from the deeper horizon of profile TR6, whereas Na/Ti, K/Ti and Sr/Ti were respectively 66%, 40% and 7% lower in the weathered granite. This isotopic shift might be related either to preferential dissolution of a very radiogenic mineral such as muscovite or to local variations in the isotopic composition of the granite. The Ca/Ti, Na/Ti, K/Ti and Sr/Ti of the soil (10–20 cm layer) of profile TR6 are 98%, 99%, 85% and 90% respectively lower than those of the weathered granite (Fig. 4a). This large loss changes the bulk soil 87Sr/86Sr ratio from 1.04 to 1.14, which shows that the ratio of the Sr released by weathering is close to that of bulk soil Sr. Strontium is released from the dissolution of K and Na feldspars and apatite. Apatite dissolution in the upper layer may explain the decrease of Ca while Na remains stable and the Sr isotope ratio increases. We may assume that the isotopic signature of the Sr released from TR6 is in the range 1–1.3, because this range covers the variation of the isotopic composition of the parent rock and soil. Evidence for the release of radiogenic Sr by rock weathering in profile TR6 is provided by the high root 87Sr/86Sr ratio (0.803) in the weathered granite (Fig. 4b). The progressive decrease of root 87Sr/86Sr ratio to 0.761 towards the soil surface reflects the decreasing input of Sr delivered by weathering versus the increasing input of atmospheric Sr, as well as the intensity of Sr cycling.
In the bulk soil of the deeply weathered profiles IF and TR11, the Sr concentrations (between 10.5 and 9.2 μg g−1) are slightly lower than the Sr concentration (14 μg g−1) in the upper horizon of TR6, and Ti concentrations are similar in these profiles. However, the 87Sr/86Sr ratio of the top soils at IF and TR11 is much lower (0.758–0.783) than in TR6 (1.14), approaching that of bioavalable Sr (plant Sr: 0.752–0.759). This change is not related to Sr adsorption on clays, because the total amount of Sr in the mineral soil (between 45 kg ha−1 at IF and 62 kg ha−1 at TR6, in the 60 cm upper layer) is 2–3 orders of magnitude greater than the content of exchangeable Sr (between 590 g ha−1 at IF and 180 g ha−1 at TR11). This means that either large amounts of Sr have been incorporated into clays (as non exchangeable Sr), or that a fraction of non radiogenic Sr is stored in primary minerals extremely resistant to weathering. The first hypothesis was used by Derry and France-Lanord (1998) to explain variations in the 87Sr/86Sr ratio of vermiculite and smectite in sediments. But this explanation does not stand in profile IF, which only contains small amounts of gibbsite. On the other hand, quartz is by far the most abundant primary mineral at IF, and at TR11. Sr concentrations, Sr/Ti and 87Sr/86Sr ratio get close in these two profiles. Quartz might contain Sr in solid or fluid inclusions and is very resistant to weathering. Unfortunately such Sr rich inclusions were not detected by SEM. The contribution of quartz to the release of Sr is difficult to assess but the stability of the Sr/Ti ratio in profiles IF and TR11 suggest that the rate of Sr release is extremely low. The 87Sr/86Sr ratio of this phase should be below that of the bulk soil, as X ray diffraction shows that some K feldspar remains in the upper horizons of IF and TR11. The persistence of a minor K-feldspar fraction in the upper horizons of profiles IF and especially TR11 might be related to the lateral redistribution of soil particles eroded from bare rock surfaces and shallow soils of the summit of the inselberg during erosion crisis.
The increase of root Sr isotopic ratio with depth, from 0.742 in the top soil to 0.770 at the depth 30–60 cm and 0.885 at 150 cm (Fig. 3b) suggests a large contribution of atmospheric Sr at the top and the release of Sr by weathering of radiogenic minerals, possibly K-feldspar (muscovite and albite are absent), in the bleached horizons of profile IF. Nevertheless, these horizons contained about 20% granitic gravel which dissolution may release radiogenic Sr and contribute to raise the root isotopic ratio. The low root isotopic ratio below the depth of 150 cm might be related to the absence of gravel in this sandy horizon, and to the accumulation of groundwater coming from surrounding bare rock surfaces.
4.3. Sources of Sr in the different vegetation typeson the inselberg
The source contribution of Sr to the “rock-savannah” communities have been calculated using two end members : atmospheric deposition (87Sr/86Sr ratio = 0.71), and bedrock 87Sr/86Sr ratio (between 1 and 1.3) At the summit of the inselberg (i1, i2), low isotopic ratios of cyanobacteria indicate that only 2–7% of Sr in cyanobacteria is supplied by rock weathering. Nevertheless, considering that the granite surface is compact on the one hand, and the very large rainfall amount on the other hand, this proportion seems significant. An explanation is that the inselberg is penetrated by a small layer of endolithic cyanobacteria (mainly Choococcidiopsis sp.) which can dissolve the granite by increasing the pH up to 10 during photosynthesis (Büdel et al., 2004). This process may cause the dissolution of most granite minerals, including quartz. This rock contribution might be underestimated because cyanobacteria may preferentially dissolve apatite, which strontium isotopic ratio is generally low. But apatite is generally included in or framed by other silicate minerals. Furthermore, Sarthou and Grimaldi (1992) showed that waters running over the cyanobacteria crusts were enriched in K, which origin is related to K feldspar dissolution.
The isotopic ratio of Pitcairnia leaves is generally very close to that of cyanobacteria in the same area, which indicates that these plants take up the Sr supplied by waters draining the cyanobacterial crusts. The87Sr/86Sr ratio of Clusiaceae leaves, always slightly elevated relative to that of cyanobacteria and Pitcairnia leaves, indicates a slightly higher Sr supply from mineral weathering in shallow organic soils. The similarity between the Sr isotopic ratios of low forest tree leaves and Vriesea splendens, usually an epiphyte, but growing here on the soil surface, below Clusia trees, indicates a direct supply from decomposing leaf litter. The 87Sr/86Sr ratio increases slightly from Clusia patches to the low forest.
At the lower end of the low forest (TR6), the computation suggests that weathering contributes 8–19% of tree Sr. The high contribution of atmospheric deposition could be expected from the ratio between the annual flux of Sr deposited from the atmosphere and the total amount of soil exchangeable Sr (6%).
The stability of tree Sr isotopic ratio along the slope from the low to the high forest is very striking, given the considerable change in soil depth and weathering stage. We propose several possible explanations.
Trees absorb Sr mainly in upper horizons, so that the influenceof the underlying bedrock is limited. Because rain Sr isdeposited on the soil surface, whereas soil weathering releasesSr from soil minerals, the isotopic ratio of bioavailable Srincreases with soil depth, which, in comparison to leaf Sr, maybe used to measure the mean depth of Sr uptake (Dambrineet al., 1997, Wickman and Jacks, 1993). Comparing rootand leaf 87Sr/86Sr ratio suggests that plant take up Sr from the upper horizons. The variation of root 87Sr/86Sr ratio in relation to depth was not evaluated in the high forest, but in a study of tropical forests on deeply weathered soils, Poszwa et al. (2002) observed very steep gradients in soils and demonstrated that almost all the Sr was taken up from the uppermost soil horizon.
The low forest is supplied with Sr by gully waters drained laterally from the savannah rock unit. These waters provide a large influx of Sr with a low isotopic ratio (0.72–0.73) which decreases the isotopic ratio of bioavailable Sr by diluting the flux of Sr released by weathering. This lateral input of elements was illustrated by Dojani et al. (2007), who measured at the same site the change in soil δ15N along the slope. Soil δ15N was +6‰ in the high forest, decreased abruptly in the low forest and reached, –1.9‰ and –1.3‰ respectively in cyanobacteria crusts and pitcainia soils. Intermediate values of δ15N in the low forest were explained by the flow of nitrogen fixed from the atmosphere by cyanobacteria and drained laterally as nitrate and amino acids toward the low forest.
Sr, as other nutrients, is taken up by roots and sprayed by litterfall over large areas. Tropical tree roots commonly prospect the surface of soils over tens of meters. Litter can also be dispersed from high trees over the same range. Along the slope, this lateral flux may homogenize chemical patterns and isotopic ratios over long distances. But this process cannot fully explain the stability of the Sr isotopic ratio along the slope.
Down the slope, surface flow disappears, as soils get deeper. The stable value of the Sr isotopic ratio in the high forest should express the mixing of the atmospheric input with a small but consistent flux derived from weathering. Otherwise this ratio should be close to that of atmospheric Sr, as it is in the Grand Plateau. This small flux may be provided by the weathering of soil particles originating from the upper slope and redistributed downslope during erosion crisis. The observation of low amounts of K feldspar in the upper layer of TR11 provides an independent argument supporting this hypothesis. Given the low isotopic ratio of the Sr phase, extremely resistant to weathering and probably included in quartz, its contribution to Sr release is most likely very low.
5. CONCLUSION
In contrast with our original hypothesis, plant Sr isotope ratio did not decrease from the summit to the bottom of the inselberg as soils get deeper and more depleted in primary minerals. Instead, the Sr isotope ratio in plants remained nearly constant from the cyanobacterial crusts on bare granite to the high forest on deep, highly weathered soils. Possible explanations include: the preferential uptake of Sr by plants in the upper soil layers; the lateral redistribution of nutrients in surface water, by litterfall, and in the form of primary minerals dispersed along the slope during recurrent erosion crisis affecting the top of the inselberg. All these processes tend to supply nutrients, especially K, from bare rock surfaces to the forest downslope. However, given the very low Ca in the bedrock, and the differences between Ca and Sr dynamics during pedogenesis, Sr isotope variations are not well suited for investigating Ca release from the granite in this tropical setting. The extremely low soil Ca content in soil minerals implies that Ca is almost exclusively supplied to the high forest by atmospheric deposition.
Acknowledgments
We warmly thank the team present at the research site “Les nouragues” (UPS 656, CNRS) for their help, hospitality and friendship. The isotopic analysis were supervised by Pierre Brunet at the university of Toulouse. We thank Pascal Bonnaud for X-ray analysis, and C. Rose for SEM observations. Linda Pardo clarified our expressions, many thanks. This project was funded by GIP-ecofor.
References
- Åberg G., 1995. The use of natural strontium isotopes as tracers in environmental studies. Water Air Soil Pollut. 79: 309–322 [CrossRef].
- Aubert D., Stille P., and Probst A., 2001. REE fractionation during granite weathering and removal by waters and suspending loads: Sr and Nd isotopic evidence. Geochim. Cosmochim. Acta 65: 387–406 [CrossRef].
- Bailey S.W., Hornbeck J.W., Driscoll C.T., and Gaudette H.E., 1996. Calcium inputs and transport in a base poor forest ecosystem as interpreted by Sr isotopes. Water Resour. Res. 32: 707–719 [CrossRef].
- Bain D.C. and Bacon J.R., 1994. Strontium isotopes as indicators of mineral weathering in catchments. Catena 22: 201–214 [CrossRef].
- Bern C.R., Townsend A.R., and Farmer G.L., 2005. Unexpected dominance of parent-material strontium in a tropical forest on highly weathered soils. Ecology 86: 626–632 [CrossRef].
- Bongers F., Charles-Dominique P., Forget P.M., and Théry M., 2001. Nouragues. Dynamics and plant-animal interactions in a neotropical rainforest, Kluwer, Dordrecht, The Netherlands. 421 p.
- Boyé M., Cabaussel G., and Perrot Y., 1979. Climatologie. Atlas de la Guyane, Collection des Atlas des Départments d'Outre Mer, II. La Guyane, CNRS et ORSTOM, Paris.
- Braun J.J., Herbillon A., and Rosin C., 1993. Mobilization and redistribution of REEs and thorium in a syenitic lateritic profile: a mass balance study. Geochim. Cosmochim. Acta 57: 4419–4434 [CrossRef].
- Büdel B., Weber B., Kühl M., Pfanz H., Sültemeyer D., and Wessels D., 2004. Reshaping of sandstone surfaces by cryptoendolithic cyanobacteria: bioalkalization causes chemical weathering in arid landscapes. Geobiology 2: 261–268 [CrossRef].
- Burke A., 2001. Determinants of inselberg floras in arid Nama Karoo landscapes. J. Biogeogr. 28: 1211–1220 [CrossRef].
- Capo R.C., Stewart B.W., and Chadwick O.A., 1998. Strontium isotopes as tracers of ecosystem processes: theory and methods. Geoderma 82: 197–225 [CrossRef].
- Chadwick O.A., Derry L.A., Vitousek P.M., Huebert B.J., and Hedin L.O., 1999. Changing sources of nutrients during four million years of ecosystem development. Nature 397: 491–497 [CrossRef].
- Charles-Dominique P., Blanc P., Larpin D., Ledru M.P., Riéra B., Sarthou C., Servant M., and Tardy C., 1998. Forest perturbations and biodiversity during the last ten thousand years in French Guiana. Acta Oecol. 19: 295–302 [CrossRef].
- Chave J., Riera B., and Dubois M.A., 2001. Estimation of biomass in a neotropical forest of French Guyana: spatial and temporal variability. J. Trop. Ecol. 17: 79–96 [CrossRef].
- Choubert B. 1974., Les Précambriens des Guyanes. BRGM, Orléans, France. 213 p.
- Clark D.A., Brown S., Kicklighter D.W., Chambers J.Q., Thomlinson J.R., Ni J., and Holland E.A., 2001. Net primary production in tropical forests: an evaluation and synthesis of existing field data. Ecol. Appl. 11: 371–384 [CrossRef].
- Clow D.W., Mast M.A., Bullen T.D., and Turk J.T., 1997. Stronium 87/strontium 86 as a tracer of mineral weathering reactions and calcium sources in an alpine/subalpine watershed, Loch Vale, Colorado. Water Resour. Res. 33: 1335–1351 [CrossRef].
- Dambrine E., Loubet M., Vega J.A., and Lissarague A., 1997. Localisation of mineral uptake by roots using Sr isotopes. Plant Soil 192: 129–132 [CrossRef].
- Depagne J. and Lelong F., 1965. Feuille de Haute Comté et notice explicative; carte géologique à l'échelle du 1/100 000. Carte géologique détaillée de la France, département de la Guyane. BRGM, Orléans, France.
- Derry L.A. and France Lanord C., 1996. Neogene Himalayan weathering history and river 87Sr/86Sr: impact on the marine Sr record. Earth planet. Sci. Lett. 142: 59–74 [CrossRef].
- Dojani S., Lakatos M., Rascher U., Wanek W., Lüttge U., and Büdel B., 2007. Nitrogen input by cyanobacterial biofilms of an inselberg into a tropical rainforest in French Guiana. Flora 202: 521–529.
- Faure G., 1986. Principles of Isotope Geology, Second edition, Wiley, New-York, NY, 589 p.
- Granville J.J., 1982. Rain forest and xeric flora refuges in French Guiana. In: Prance G.T. (Ed.), Biological diversification in the tropics. Colombia Univ. press, New York, NY, p. 159–181.
- Graustein W.C. and Armstrong R.L., 1983. The use of strontium 87Sr/86Sr ratios to measure atmospheric transport into forested watersheds. Science 219: 289–292 [PubMed] [CrossRef].
- Graustein W.C., 1989. 87Sr/86Sr ratios measure the source and flow of Sr in terrestrial ecosystems. In: Rundel P., Ehleringer J., and Nagy K. (Eds.), Stable isotopes in ecological research, Springer, New York, pp. 491–512
- Grimaldi M. and Riéra B., 2001. Geography and climate. In: Bongers F., Charles-Dominique P., Forget P.M., and Théry M. (Eds.), Nouragues: Dynamics and plant-animal interactions in a neotropical rainforest, Kluwer, Dordrecht, pp. 9–18.
- Grousset F.E., Rognon P., Coude Gaussen G., and Pedemay P., 1992. Origins of peri-Saharian dust deposits traced by their Nd and Sr isotopic composition. Palaeogeogr. Palaeoclimatol. Palaeoecol. 93: 203–212 [CrossRef].
- Gruau G., Martin H., Leveque B., and Capdevila R., 1985. Rb-Sr and Sm-Nd geochronology of lower proterozoic granite-greenstone terrains in French Guyana, South America. Precambrian Res. 30: 63–80 [CrossRef].
- Hodson M.E., 2002. Experimental evidence for mobility of Zr and other trace element in soils. Geochim. Cosmochim. Acta 66: 819–828 [CrossRef].
- Jordan C.F., 1982. The nutrient balance of an Amazonian rain forest. Ecology 63: 647–654 [CrossRef].
- Kennedy M.J., Chadwick O.A., Vitousek F.M., Derry L.A., and Hendricks D.M., 1998. Changing sources of base cations during ecosystem development, Hawaiian Islands. Geology 26: 1015–1018 [CrossRef].
- Larpin D., Sarthou C., and Tardy C., 2000. Dynamique de la végétation sur l'inselberg des Nouragues (Guyane française) à différentes échelles de temps (pluriannuelle à plurimillénaire). In: Servant M., Servant-Vildary S. (Eds.), Dynamique à Long Terme des Ecosystèmes Forestiers Intertropicaux, UNESCO, Paris, France, pp. 189–197.
- Marschner 1995. Mineral nutrition of higher plants, 2nd ed., Academic Press, London, 889 p.
- Meybeck M., 1986. Composition chimique naturelle des ruisseaux non pollués en France. Sci. Géol. Bull. Strasbourg 39: 3–77.
- Miller E.K., Blum J.D., and Friedland A.J., 1993. Determination of soil exchangeable-cation loss and weathering rates using Sr isotopes. Nature 362: 438–441 [CrossRef].
- Nakai S., Halliday A.N., and Rea D.K., 1993. Provenance of dust in the Pacific Ocean. Earth Planet. Sci. Lett. 119: 143–157 [CrossRef]
- Négrel P., Lachassagne P., and Laporte P., 1997. Caractérisation chimique et isotopique des pluies de Cayenne (Guyane française). C. R. Acad. Sci. Paris, Ser. 2, 324: 379–386.
- Négrel P. and Lachassagne P., 2000. Geochemistry of the Maroni River (French Guyana) during low water stage: implications for water rock interaction and groundwater characteristics. J. Hydrol. 237: 212–233 [CrossRef].
- Poncy O., Sabatier D., Prévost M.F., and Hardy I., 2001. The lowland high rainforest: structure and tree species diversity. In: Bongers F., Charles-Dominique P., Forget P.M., and Théry M. (Eds.), Nouragues: Dynamics and Plant-Animal Interactions in a Neotropical Rainforest, Kluwer, Dordrecht, The Netherlands, pp. 31–46.
- Porder S., Clark D.A., and Vitousek P.M., 2006. Persistence of rock-derived nutrients in the wet tropical forests of the Selva, Costa Rica. Ecology 87: 594–602 [PubMed] [CrossRef].
- Porder S., Paytan A., and Vitousek P.M., 2005. Erosion and landscape development affect plant nutrient status in the Hawaiian Islands. Oecologia 142: 440–449 [PubMed] [CrossRef].
- Porembski S. and Barthlott W., 2000. Inselbergs : Biotic Diversity of Isolated Rock Outcrops in Tropical and Temperate Regions, Springer, Berlin, Germany, 528 p.
- Poszwa A., Dambrine E., Pollier B., and Atteia O., 2000. A comparison of Ca and Sr cycling in forest ecosystems. Plant Soil 225: 299–310 [CrossRef].
- Poszwa A., Dambrine E., Ferry B., Pollier B., and Loubet M., 2002. Do deep tree roots provide nutrients to the tropical rainforest? Biogeochemistry 60: 97–118.
- Probst A., El'GhMari A., Aubert D., Fritz B., and McNutt R., 2001. Strontium as a tracer of weathering processes in a silicate catchment polluted by acid atmosperic inputs, Strengbach, France. Chem. Geol. 170: 203–219 [CrossRef].
- Puig H. and Delobelle J.P., 1988. Production de litière aérienne, nécromasse, apports minéraux au sol par la litière en forêt guyanaise. Rev. Ecol. 43: 3–22.
- Rascher U., Lakatos M., Büdel B., and Lüttge U., 2003. Photosynthetic field capacity of cyanobacteria in small scale zones across the furrows of an inselberg of the Guyana Highlands. Eur. J. Phycol. 38: 247–256 [CrossRef].
- Rosique T., Pous S., and Charles-Domminique P., 2000. Evolution morphogénique holocène d'un bassin versant de la forêt guyanaise : La Nourague occidentale (Guyane Française). C. R. Acad. Sci. Paris, Ser. 2, 330: 333–340.
- Sarthou C., 1992. Dynamique de la végétation pionnière sur un inselberg en Guyane française. M.S. thesis, Université Pierre et Marie Curie, Paris, France.
- Sarthou C. and Grimaldi C., 1992. Mécanismes de colonisation par la végétation d'un inselberg granitique en Guyane Française. Revue Ecol. 47: 329–349.
- Sarthou C., Therezien Y., and Coute A., 1995. Cyanophycées de l'inselberg des Nouragues (Guyane Française). Nova Hedwigia 61: 85–109.
- Sarthou C. and Villiers J.F., 1998. Epilithic plant communities on French Guiana Inselberg. J. Veg. Sci. 9: 847–859 [CrossRef].
- Swap R., Garstang M., and Greco S., 1992. Saharian dust in the Amazon basin. Tellus. 44B: 133–149.
- Tardy Y., 1993. Pétrologie des latérites et des sols tropicaux, Masson, Paris, France. 459 p.
- Vaçulik A., Kounda-kiki C., Sarthou C., and Ponge J.F., 2004. Soil invertebrate activity in biological crusts on tropical inselbergs. Eur. J. Soil Sci. 55: 539–549 [CrossRef].
- White A.F. and Brantley S.L., 1995. Chemical weathering rates of silicate minerals. Rev. Mineral. 31: 1–583 p.
- Wickman T. and Jacks G., 1993. Base cation nutrition for pine stands on lithic soils near Stockholm, Sweden. Appl. Geochem. Suppl. 2: 199–202 [CrossRef].
All Tables
Strontium, Ca, K, P concentrations and 87Sr/86Sr isotopic ratio in leaves and leaf litters of the different plant species sampled on the Nouragues site.
All Figures
|
Figure 1 Nouragues site. (a) General view of relief, vegetation units and sampling locations on the Nouragues inselberg; (b) Savannah rock main vegetation sampling locations on depressions at the summit of the inselberg and on the high terrace; (c) Soil and litter sampling locations on the transect (TR) from the high terrace to the basis of the inselberg. |
| In the text | |
|
Figure 2 Soil total carbon content and exchangeable Ca concentration in the horizons 0–10 cm in relation to the total depth of soil profiles. |
| In the text | |
|
Figure 3 Soil profile IF. (a) Proportion of Ca, Sr, and K remaining after weathering and dissolution according to soil depth; (b) 87Sr/86Sr isotopic ratio of granite, bulk soil and roots according to depth. |
| In the text | |
|
Figure 4 Soil profile TR6. (a) Proportion of Ca, Sr, K and Na remaining after weathering and dissolution according to soil depth; (b) 87Sr/86Sr isotopic ratio of granite, bulk soil and roots according to depth. |
| In the text | |
|
Figure 5 Soil profile TR11. (a) Proportion of Ca, Sr, and K remaining after weathering and dissolution according to soil depth; (b) 87Sr/86Sr isotopic ratio of granite, bulk soil and roots according to depth. |
| In the text | |
|
Figure 6 Correlation between Ca and Sr concentrations in the different plant organs sampled on the Nouragues site (savannah, low and high forest). |
| In the text | |