Journals
Books
Conferences
EDPS Account
Login
All issues
Special issues
About
Search
Menu
All issues
About the journal
Aims and scope
Copyright transfer
Reader services
Advanced Search
All issues
Volume 66 / No 3 (April-May 2009)
Ann. For. Sci., 66 3 (2009) 301
Full HTML
All issues
About the journal
Aims and scope
Copyright transfer
Reader services
Free Access
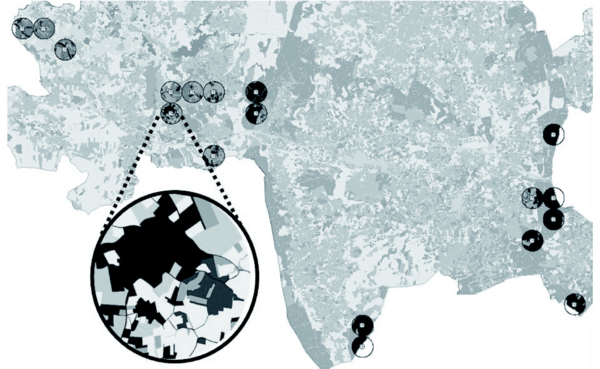
Figure 2
Distribution of plots, and detail of one of the 500 m buffer areas (GTM).
Download original image
Homepage
Table of Contents
Previous article
Next article
Article contents
Abstract
Full HTML
PDF (938.7 KB)
References
Services
Articles citing this article
CrossRef (21)
Same authors
-
Google Scholar
-
EDP Sciences database
-
PubMed
Recommend this article
Download citation
Related Articles
Riparian vegetation metrics as tools for guiding ecological restoration in riverscapes
Knowl. Managt. Aquatic Ecosyst. (2011) 402, 21
Development of alder carr after the abandonment of wet grasslands during the last 70 years
Ann. For. Sci. 66, 1-13 (2009)
Potential use of pine plantations to restore native forests in a highly fragmented river basin
Ann. For. Sci. 66, 1-11 (2009)
Predator/prey ratios: a measure of bark-beetle population status influenced by stand composition in different French stands after the 1999 storms
Ann. For. Sci. 63, 301-308 (2006)
Biodiversity: function and assessment in agricultural areas. A review
Agron. Sustain. Dev. 25, 1-15 (2005)
More
Bookmarking
Mendeley
Reader's services
Email-alert