Free Access
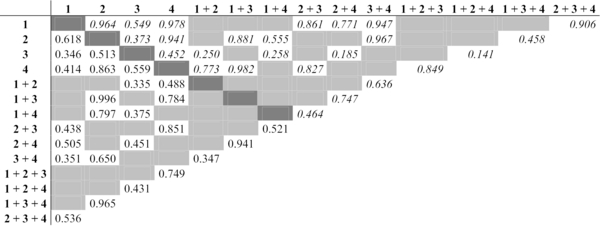
Table I
P values of paired t tests (N = 32) comparing means of % Visual Crown Transparency or % Visual Crown Discoloration (in italic) of poplar trees calculated with different combinations of one, two or three sub-plots per stand, after angular transformation (arcsin√ (x)).


