Free Access
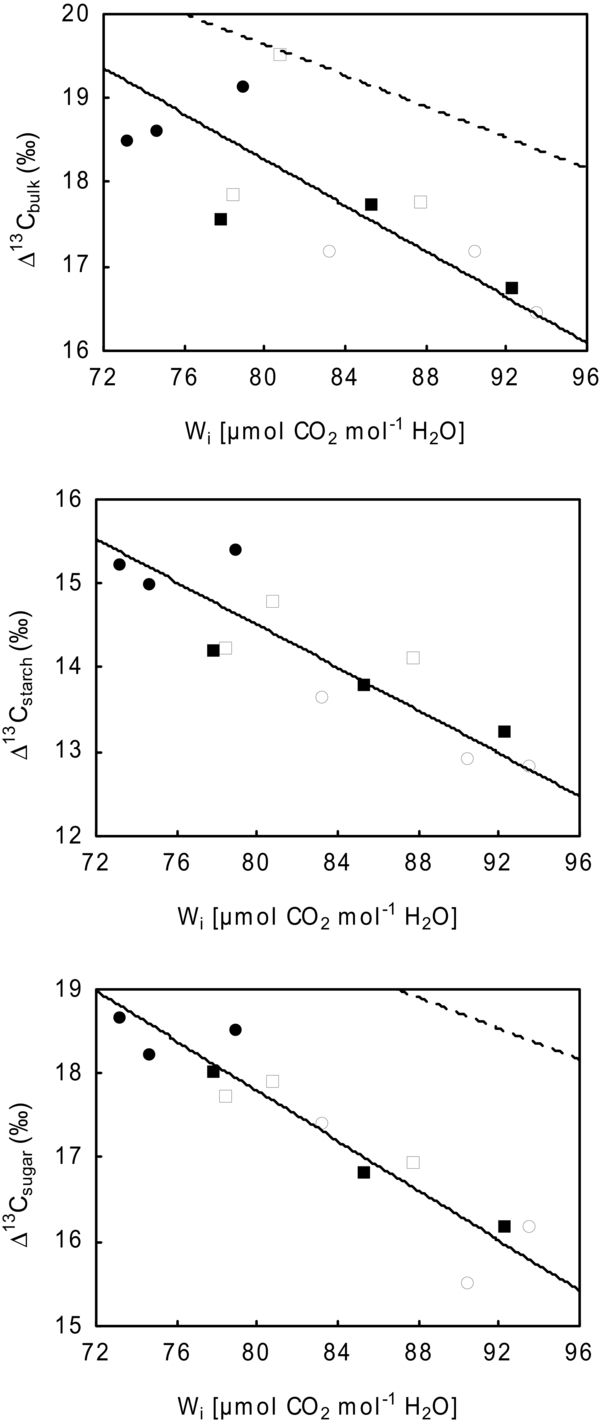
Figure 1

Relationship between genotype means of 13C isotope discrimination (soluble sugars (Δ13Csugars), starch (Δ13Cstarch) and bulk matter (Δ13Cbulk) and Wi for the phenotypes “Δ”and “N”. Open circles represent genotypes with the phenotype “low Δ”, open squares “low N”, closed circles “high Δ”, closed squares “high N”. The dash line represents the theoretical relationships (Sect. 2.2.)


