Free Access
Figure 3
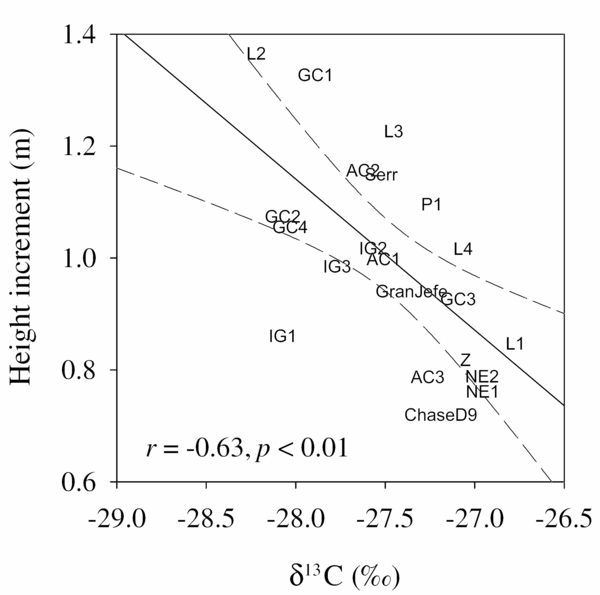
Relationship between family means of leaf δ13C and height increment across two consecutive years (2006 and 2007). Dashed lines indicate the 95% confidence interval.
Relationship between family means of leaf δ13C and height increment across two consecutive years (2006 and 2007). Dashed lines indicate the 95% confidence interval.