Free Access
Figure 6
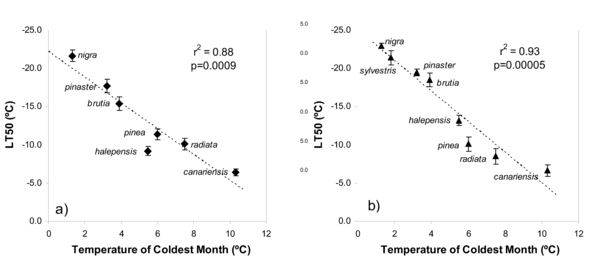
Relationship between mean temperature of the coldest month at the seed source (averaged within each species’ provenance) and LT50. (a) Primary needles and (b) secondary needles. LT50 data points represent means and bars represent 95% confidence intervals for n = 6 individuals per species.