Free Access
Figure 4
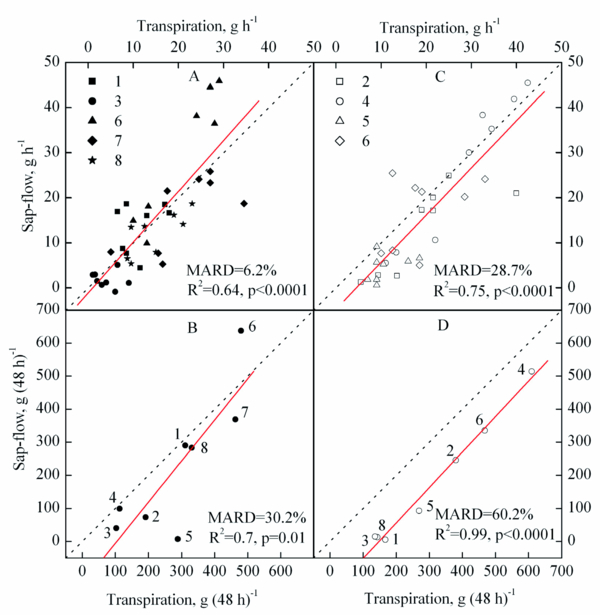
Correlations between hourly based sap flow and transpiration rates (A, C) and accumulated sap flow and transpiration (B, D) in seedlings measured by Dayau-gauges (A, B), and EMS-type gauges (C, D) from DOY 171 to 173. Dotted lines represent 1:1 linear correlations and solid lines are from regressions. Each symbol in A and C represents a data point for an individual seedling (five seedlings for Dayau-gauges and four for EMS-type gauges). The data displayed in B and D represent values obtained from eight and seven seedlings, respectively.