Free Access
Figure 1
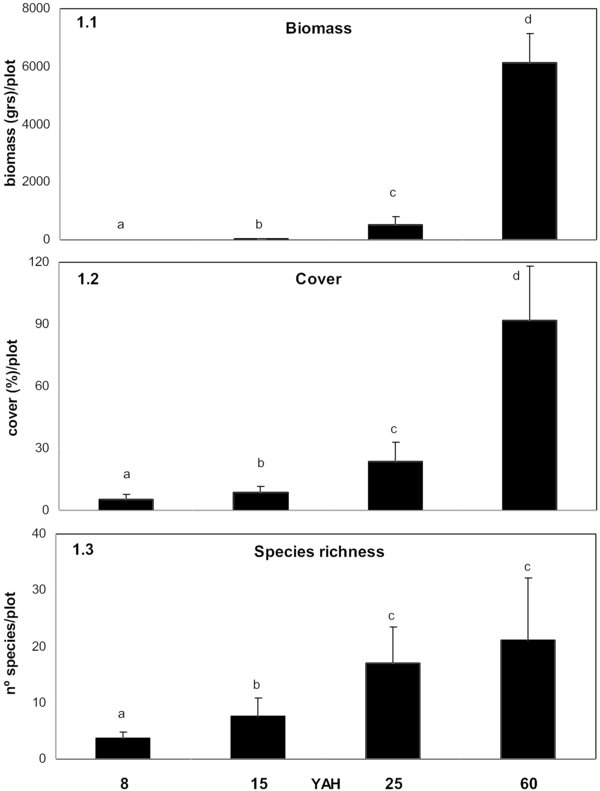
Mean values and standard deviations per plot through the chronosequence for the three parameters of epiphytic bryophytes: (1.1) biomass (g/plot); (1.2) cover (% cover/plot); and (1.3) species richness (number of species/plot). Identical letters above the bars indicate non-significant differences. YAH = years after harvest.