Free Access
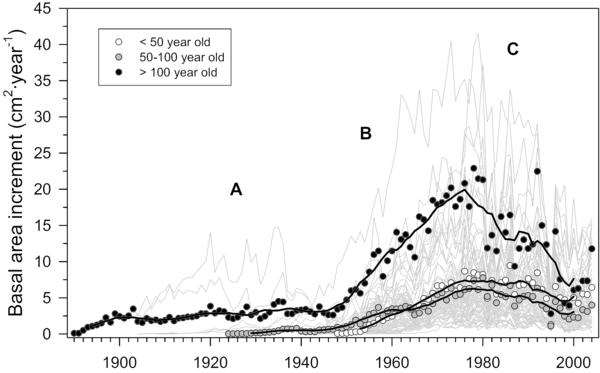
Figure 4

Mean basal area increment (BAI) over time for dominant and co-dominant trees less than 50 years old (white circles), between 50 and 100 y old (gray circles), and more than 100 years old (black circles). Secondary growth showed a low BAI until 1950s (A), establishment of new cohorts and positive trend until the end of the 1970s (B), and growth decrease in the three last decades of the 20th century (C). Each gray line corresponds to one sampled tree.


