Free Access
Figure 5
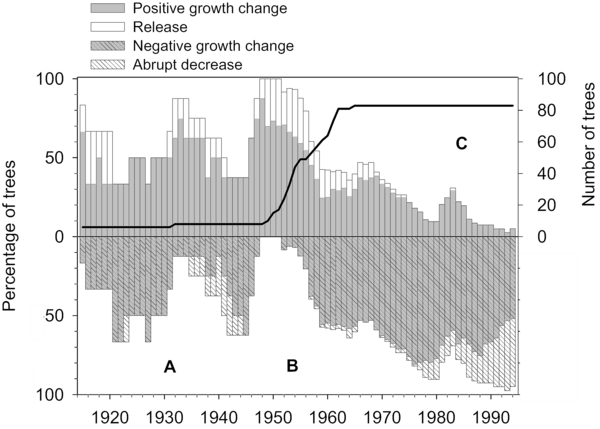
Annual distribution of releases (top white bars) and abrupt decreases (bottom light bars) based on growth change percentage (GCP) values. Frequency of trees with positive and negative GCP is also shown. Solid line represents the number of trees that reached the height of diameter at breast height (DBH) at this year. Growth trend showed oscillating periods of positive and negative GCP until 1950s (A), release and stem reinitiation in the 1950s (B), and widespread decrease after full site occupancy (C).