Figure 2
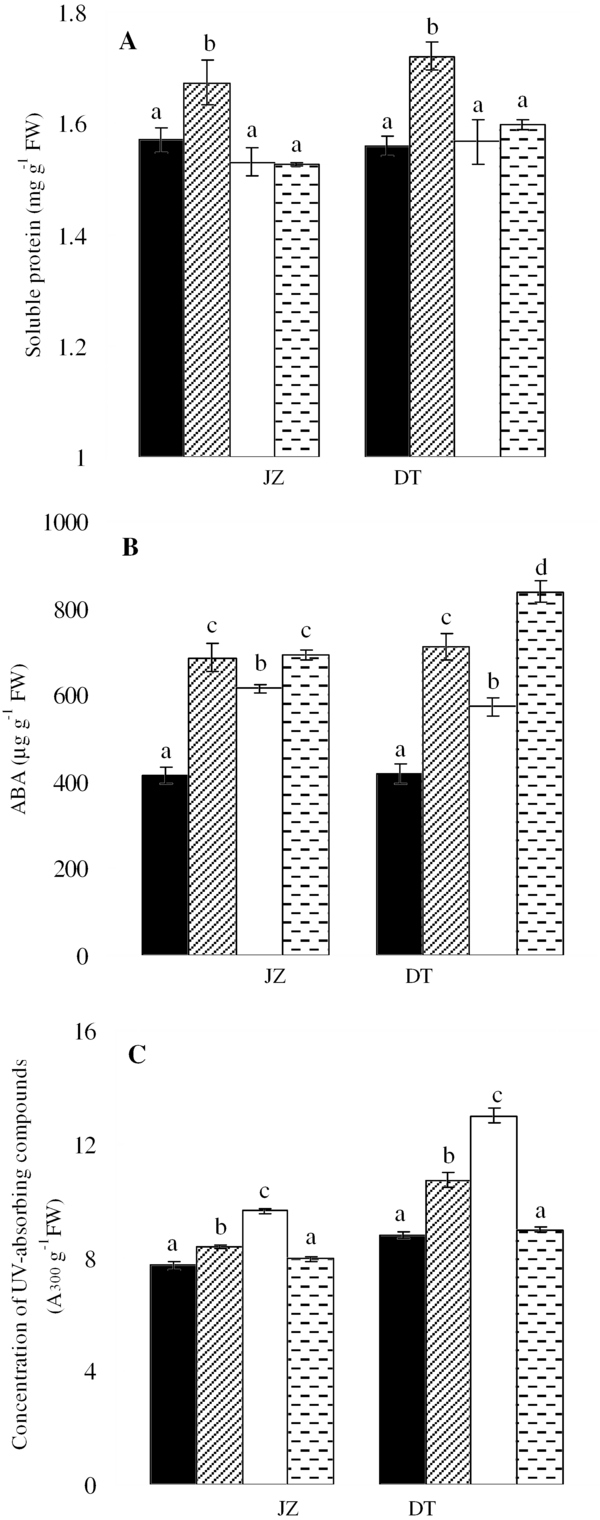
Soluble protein content (A), abscisic acid (ABA) concentration (B) and UV-absorbing compounds concentration (C) in two contrasting P. cathayana populations exposed to different UV-B levels under well-watered or drought-stressed conditions. FW: fresh weight. JZ, the population from the low altitude; DT, the population from the high altitude. Treatments: well-watered+no enhanced UV-B application (black area), drought+no enhanced UV-B application (lined area), well-watered+enhanced UV-B application (white area), drought+enhanced UV-B application (stippled area). Different letters above the bars denote statistically significant differences between treatments at the P < 0.05 level according to Duncan’s multiple range test. Values are means ± SE, n = 5.