Figure 3
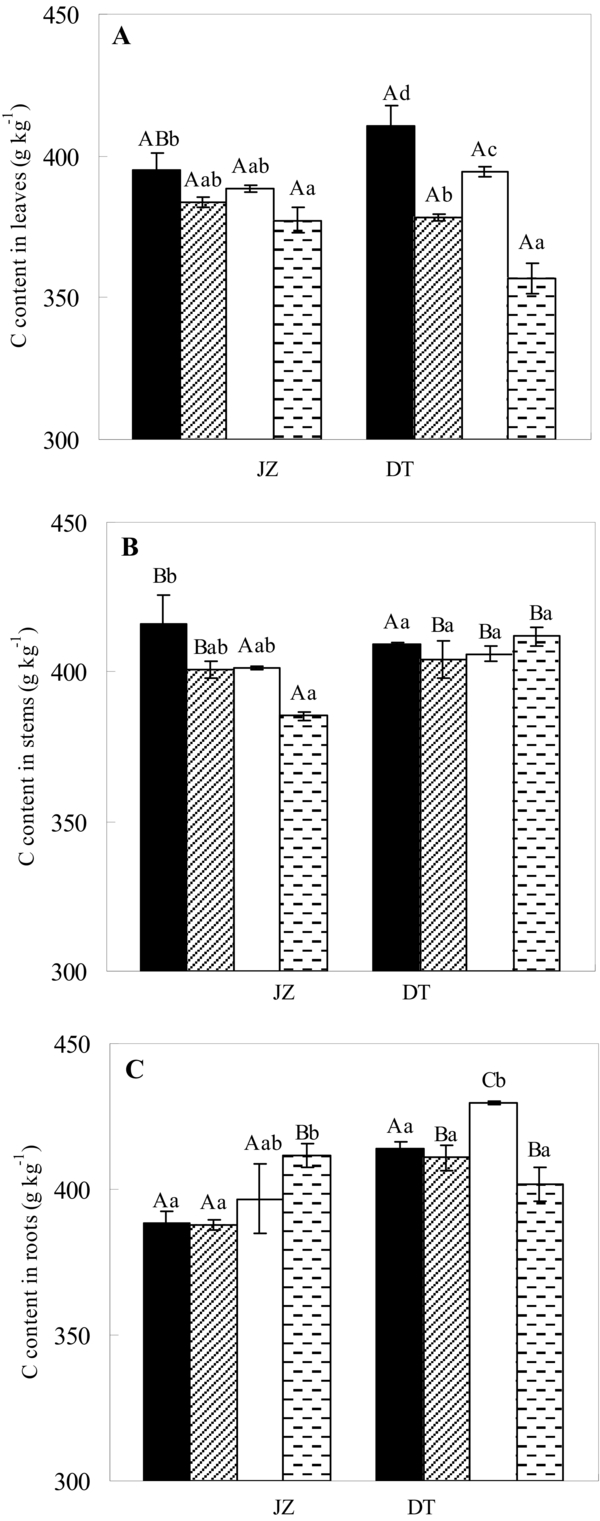
Carbon content in leaves (A), stems (B) and roots (C), respectively, in two contrasting P. cathayana populations exposed to different UV-B levels under well-watered or drought-stressed conditions. JZ, the population from the low altitude; DT, the population from the high altitude. Treatments: well-watered+no enhanced UV-B application (black area), drought+no enhanced UV-B application (lined area), well-watered+enhanced UV-B application (white area), drought+enhanced UV-B application (stippled area). Values followed by the same small letters above the bars are not significantly different at P < 0.05 level according to Duncan’s multiple range test. Different capital letters above the bars refer to significant differences between the organs under the same population and treatment at the P < 0.05 level according to Duncan multiple range test, respectively. Values are means ± SE, n = 5.