Free Access
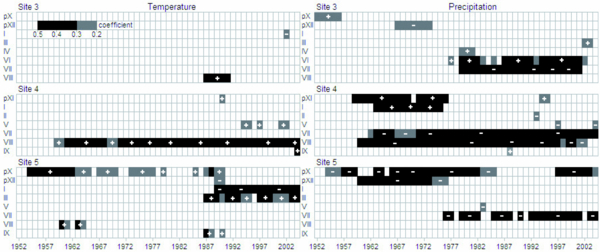
Figure 5

Climate-growth relationship: Moving 48-year correlation functions between mean monthly temperature and precipitation (in previous and given years) and residual chronologies at Sites 3, 4 and 5. Signs indicate positive or negative correlation. Grey, grey/black and black colours express the power of correlation. Only significant month correlations are shown in the diagram (P < 0.05); p = previous year climate variable.


