Figure 2
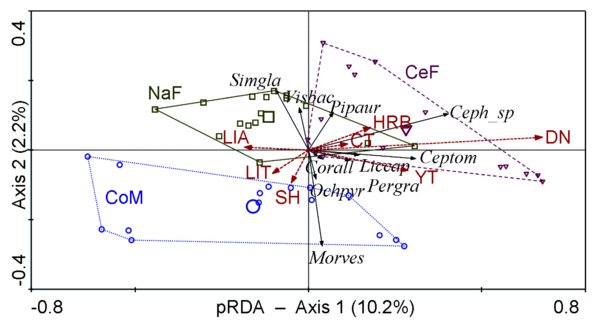
Partial redundancy analysis (pRDA) ordination diagram, plotting sample (gap) scores (small symbols) and class centroids of forest management types (large symbols) along with 10 taxa having the best fit. Distances between sample scores and between centroids correspond to Euclidean distances. Envelopes are drawn around samples of each management type, with sample scores represented as symbols (CeF = down triangle, CoM = circle, NaF = square). Arrows representing taxa point in the direction of increasing abundance. Axes 1 and 2 are constrained: management type is used as the explanatory variable. The percentage of variance in the floristic dataset (52 taxa) explained by each axis is indicated in brackets. Management-neutral (MN) gap characteristics are used as covariables. Management-sensitive (MS) gap characteristics are supplementary variables added to the ordination post hoc by regressing their data onto the ordination axes. Abbreviations for MS gap characteristics are as follows: DN = density, HRB = herb coverage, SH = shrub coverage, LIT = litter coverage, LIA = liana coverage, CT = coverage of canopy trees, YT = coverage of young trees.