Free Access
Figure 3

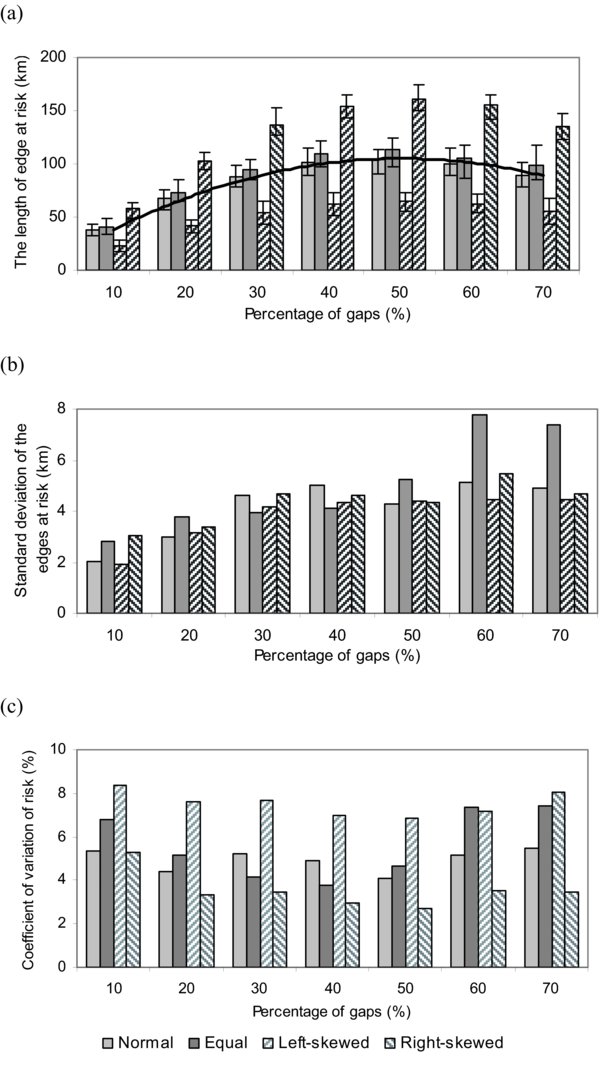
The average for total length of edges at risk (a), its standard deviation (b), and coefficient of variation, CV within the 100 iterations(c). The curve in (a) is the trend of the mean values.

The average for total length of edges at risk (a), its standard deviation (b), and coefficient of variation, CV within the 100 iterations(c). The curve in (a) is the trend of the mean values.