Free Access
Figure 2
Download original image
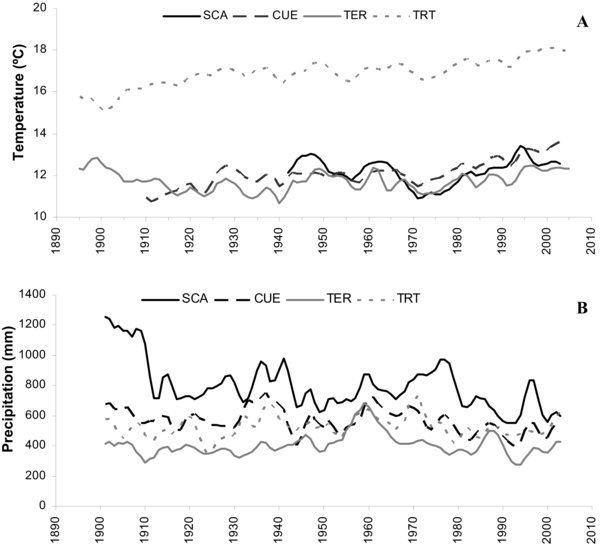
Mean annual temperature (A) and precipitation (B) of the four meteorological stations used (5-y low pass filter applied). r Values for time trends of temperatures, (i) all periods available: SCA (0.05), CUE (0.81*), TER (0.48*), TRT (0.85*); (ii) the period 1973—2005: SCA (0.89*), CUE (0.97*), TER (0.86*), TRT (0.92*). r Values for time trends of precipitations, (i) all periods available: SCA (–0.58*), CUE (–0.42*), TER (–0.10), TRT (0.09); (ii) the period 1960–2005: SCA (–0.60*), CUE (–0.73*), TER (–0.58*), TRT (–0.44*). * Significant at p < 0.05.