Free Access
Figure 3
Download original image
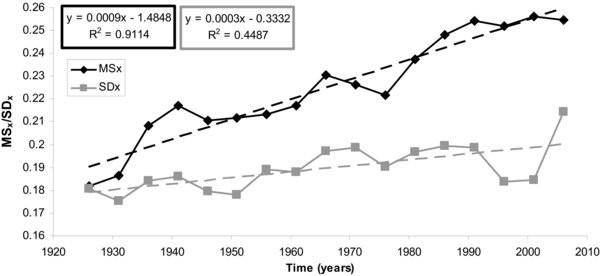
Temporal trend of the mean sensitivity of all sub-regional chronologies (Msx; black line) and the standard deviation of the mean sensitivity (SDx; grey line) calculated for intervals of 40 y lagged 5 y.