Free Access
Figure 5
Download original image
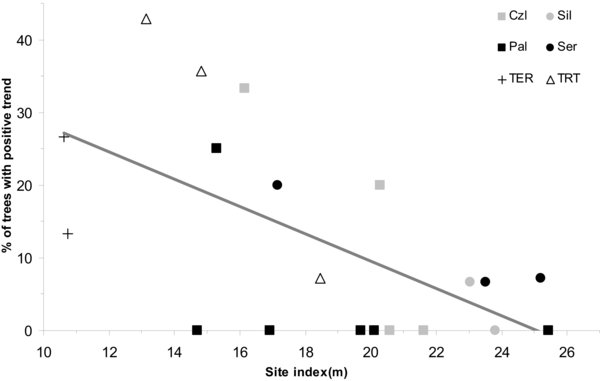
Percentage of trees with positive growth trends against site index for each plot. Correlation calculated for all the plots (r = 0.61, p < 0.005). Mean site index is calculated as the average of the site index (height of the 100 trees with largest diameters per hectare) in each plot.