Free Access
Figure 6
Download original image
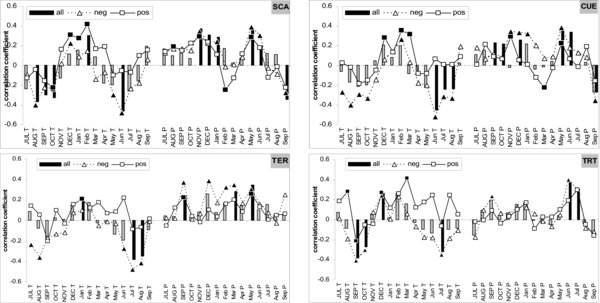
Correlation coefficients between mean monthly temperature (T) and total month precipitation (P) and standard tree-ring width indexes with complete chronologies (bars) of negative (neg; triangles) and positive (pos; squares) trenders in each region (period 1940–2005). Climate variables with capital letters correspond to the year previous to tree-ring formation. Black bars and solid symbols: 95% bootstrapped significant values.