Free Access
Figure 7
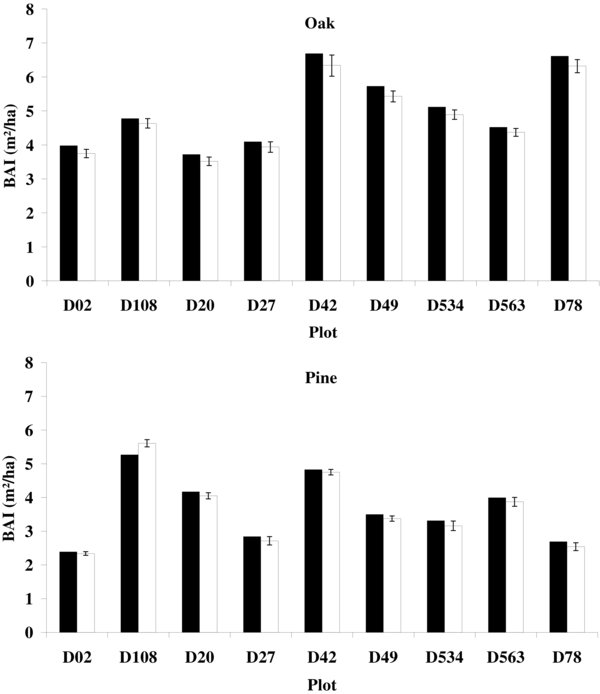
Basal area increment (m2/ha) for oak and pine after 12 y of growth simulation. For each species, predictions of two models are shown: the distance-dependent model (in black) and the neighbourhood distributions-based model (in white) for which vertical bars represent 95% CI.