Free Access
Figure 3

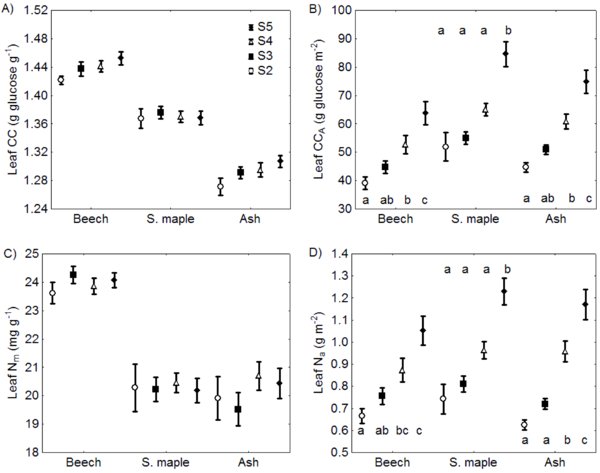
Vertical distribution of (A) leaf specific construction costs (CC), (B) leaf construction cost per unit leaf area (CCa), (C) leaf nitrogen per unit mass (Nm), and (D) leaf nitrogen per unit area (Na). Box-plots represent mean values and ± standard errors for four vertical crown layers of equal widths. S2 is the lowest and S5 the topmost layer. The bottommost layer S1 was excluded from the analysis because many plants had no leaves there. Differences between layer mean values were tested with Wilcoxon-pair test. Significant differences are denoted by different letters (p < 0.05).


