Free Access
Figure 4
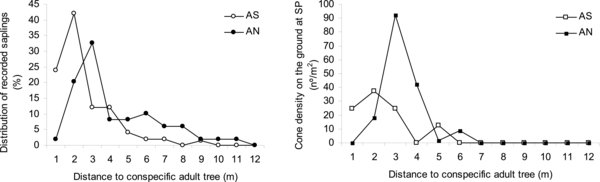
Distribution of cones on the ground and relative abundance of saplings (frequency) in relation to distance to nearest adult for sites Afur South (AS) and Afur North (AN). Cone density was measured at each sapling point (SP) in four 20 × 20 cm quadrates, located symmetrically around the individual/point within a circle of 1 m. Distribution of saplings are represented as percentage of saplings per distance classes.