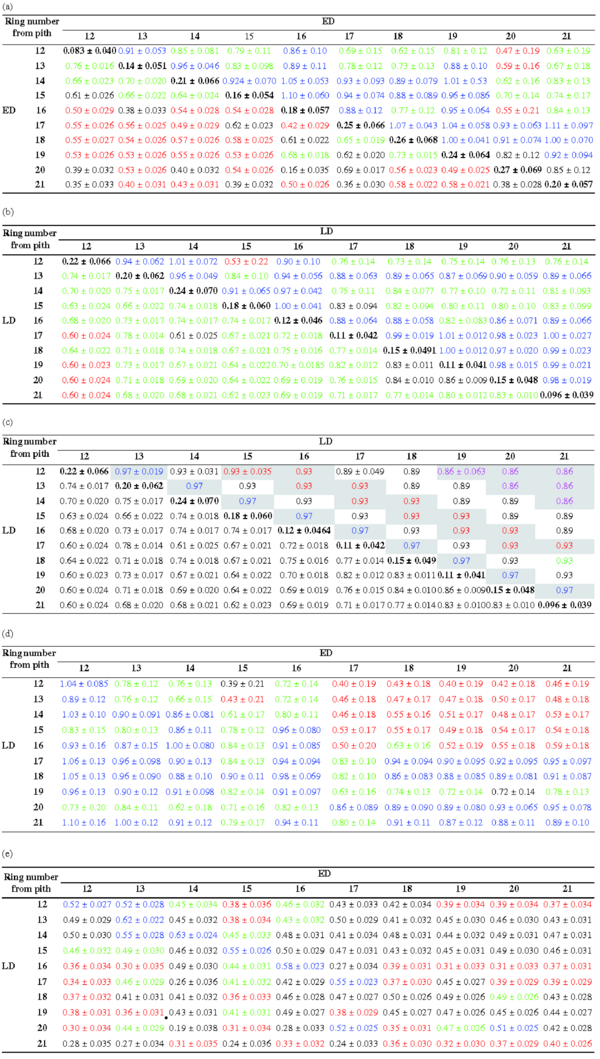
Table A
Heritabilities, and genetic and phenotypic correlations between annual rings including standard errors from the multiple-trait analysis. (a) Earlywood density (ED). Heritabilities h2 along the emboldened diagonal, genetic correlations (rA) above the diagonal and phenotypic correlations (rP) below. Blue figures indicate rP/ rA > 0.86, green rP/ rA = 0.61− 0.85, red rP/ rA = 0.40− 0.60 and black rP/ rA< 0.40. (b) Latewood density (LD). Heritabilities h2 along the emboldened diagonal, genetic correlations (rA) above the diagonal and phenotypic correlations (rP) below. Blue indicates rP/ rA > 0.86, green rP/ rA = 0.61− 0.86, red rP/ rA = 0.40− 0.60 and black rP/ rA< 0.40. (c) Latewood density (LD). Heritabilities h2 along the emboldened diagonal, banded genetic correlations (rA) above the diagonal and phenotypic correlations (rP) below the diagonal. (d) Genetic correlations (rA) from the multiple-trait correlation analysis between earlywood and latewood density (ED and LD, respectively) in the ten annual rings. Blue indicates rA > 0.85, green rA = 0.61− 0.85, red rA = 0.40− 0.60 and black rA< 0.40. (e) Phenotypic correlations (rP) from the multiple-trait correlation analysis between earlywood and latewood density (ED and LD, respectively) in the ten annual rings. Blue indicates rP > 0.50, green rP = 0.41− 0.50, red rP = 0.30− 0.40 and black rP< 0.30.