Free Access
Figure 6
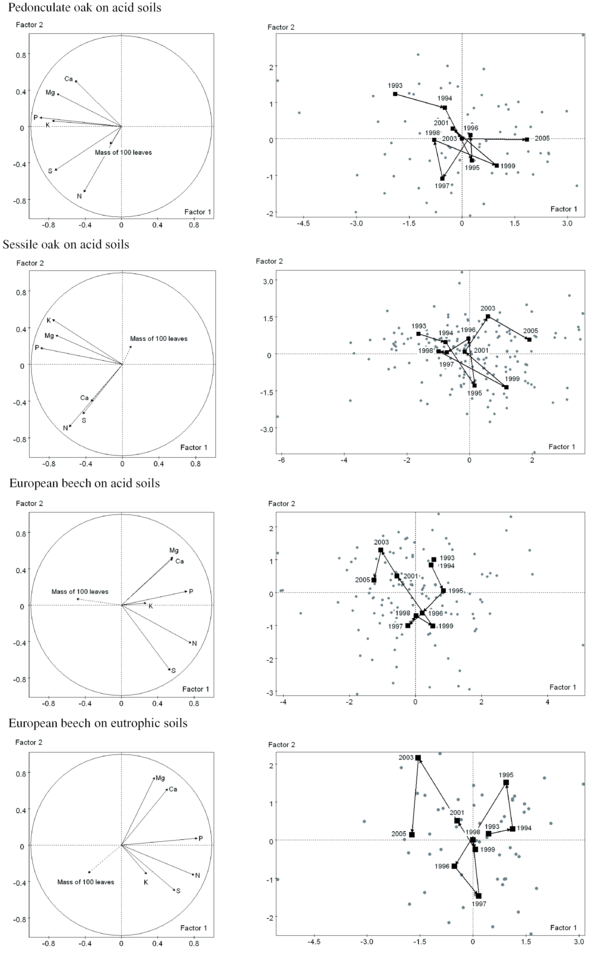
Principal component analyses carried out on the foliar concentrations after removal of the plot effect. In the variable representations (left), dashed lines are for illustrative variables; in the individual representations (right), the centers of gravity of the various years (illustrative variable) were positioned and connected to each other.