Free Access
Figure 4
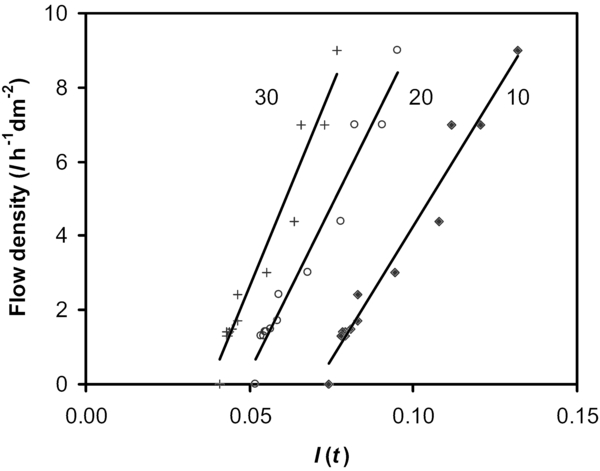
Regression lines of the gravimetrically measured water flow density ume versus I (ti) for ti = 10, 20 and 30 s during the cooling phase (data set A).
Regression lines of the gravimetrically measured water flow density ume versus I (ti) for ti = 10, 20 and 30 s during the cooling phase (data set A).