Free Access
Figure 6
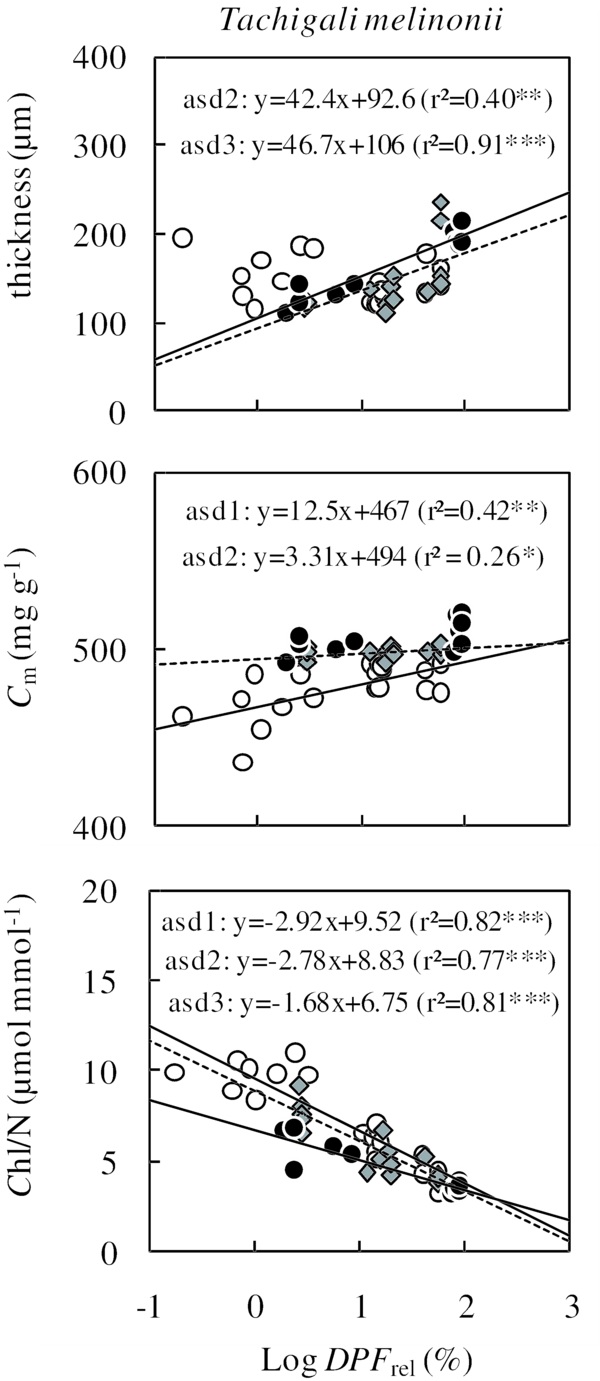
Relationships between leaf thickness (μ m), leaf C content (Cm, mg g−1), ratio of chlorophyll content on N content (Chl/N, μ mol mmol−1) and relative daily photon flux (logDPFrel, %) for the three stages of architectural development (ASD 1, white dots, ASD 2 grey diamonds and ASD 3 black dots) of Tachigali melinonii. Regression equations, level of significance (P) and coefficient of determination (r2) are indicated for statistically significant linear regressions. Significant levels: ns, P > 0.05; * P < 0.05; ** P < 0.01 and *** P < 0.001.