Free Access
Figure 5
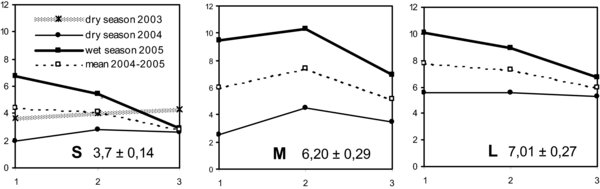
Comparison of the SFD depth profile for the small trees (S), the medium trees (M) and the large trees (L), in dm3 d−1 dm−2.
Comparison of the SFD depth profile for the small trees (S), the medium trees (M) and the large trees (L), in dm3 d−1 dm−2.