Open Access
Figure 1
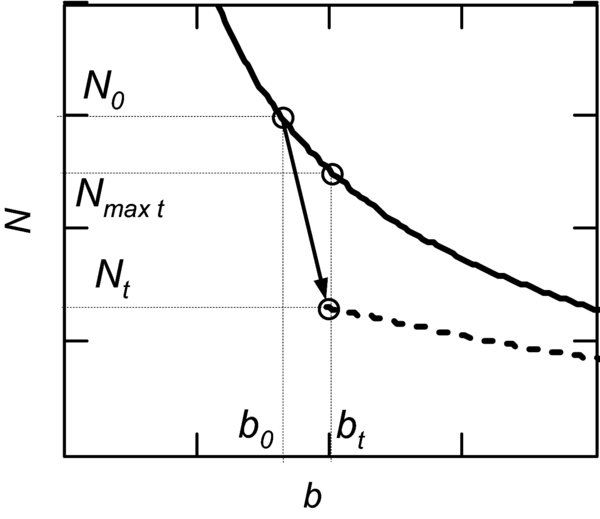
Closure (c) after a thinning. The figure shows thinning removal of N0 − Nt trees, which are smaller than the average tree (thinning from below). This leads to an increase in mean tree size (b) from b0 before thinning to bt after the thinning. c after the thinning is given by N after thinning (Nt) divided by the Nmax (solid line) corresponding to bt (Nmax t). The dashed line shows the development after thinning.