Open Access
Figure 2
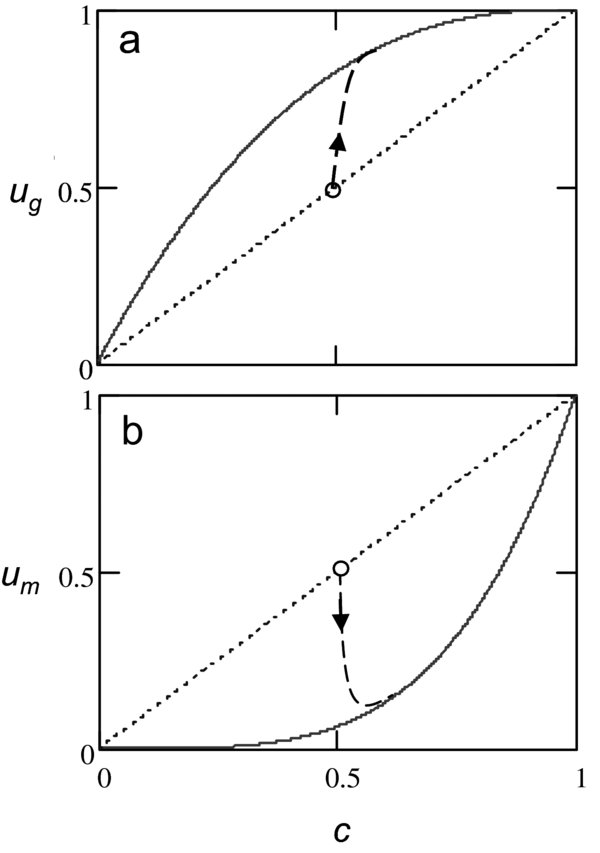
The response of growth rate (ug) and mortality (um) to stand closure (c). Dotted straight lines show the responses immediately after thinning before the trees have utilized the new growing space available. The solid lines show the acclimated responses and the dashed lines show the effect of a thinning to c = 0.5 followed by acclimation.