Free Access
Figure 2
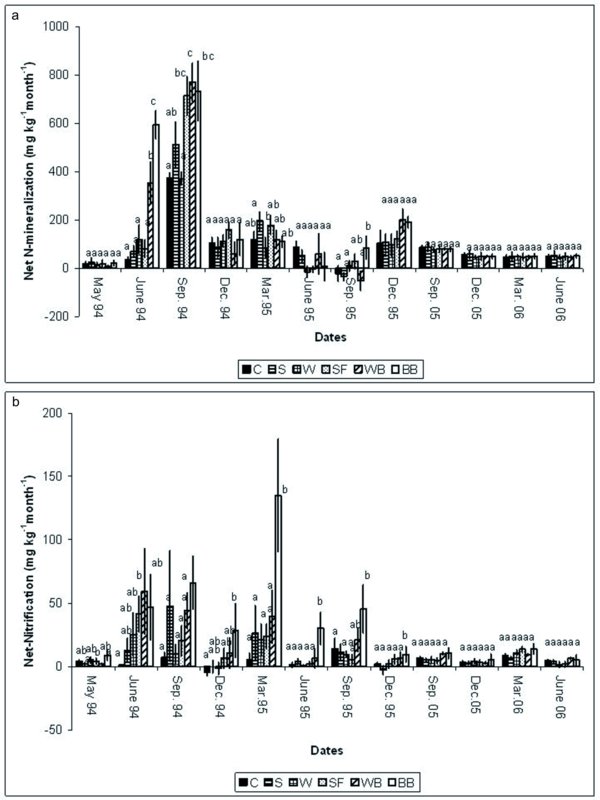
Net mineralization (a) and net nitrification (b) at different times after harvesting and slash management. Vertical bars, standard error. Symbols as in Figure 1. Note the different scales. Values indicated by the same letter in the same measurement date did not differ significantly (p < 0.05).