Figure 4
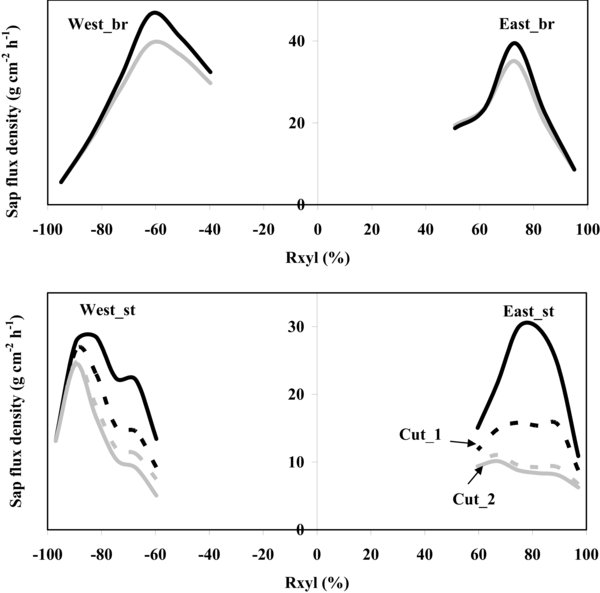
Upper panels: radial pattern of sap flux densities measured at two opposite sides of the main branch before (black lines) and after (grey lines) the two cuts. Due to high variability in data measured just below the crown, they were averaged for 15-min intervals before cutting and after the second cut. Lower panels: radial pattern of sap flux densities measured on the eastern and the western sides of the maple stem 1 min before cut_1 (black solid line – 11.53) and cut_2 (gray dashed line – 13.47), as well as 2 min after the second cut (black dashed line corresponds to the time 11.56 after cut_1 and grey solid line corresponds to the time 13.50 after cut_2). Differences between black and grey dashed lines demonstrate changes in radial pattern due to the time lag between the two cuts (11.54–13.48). See also Figure 4 for details where dynamics of SFD are presented during the day of the main cutting experiment. Negative X-axes were used for the western side in order to illustrate its opposite direction better compared with the eastern side and the position of the pith in the middle. Symbols indicating measured points along radial profiles were omitted for clarity and better visualization of radial pattern changes. Rxyl means stem radius in a measured place without bark thickness.