Free Access
Figure 2
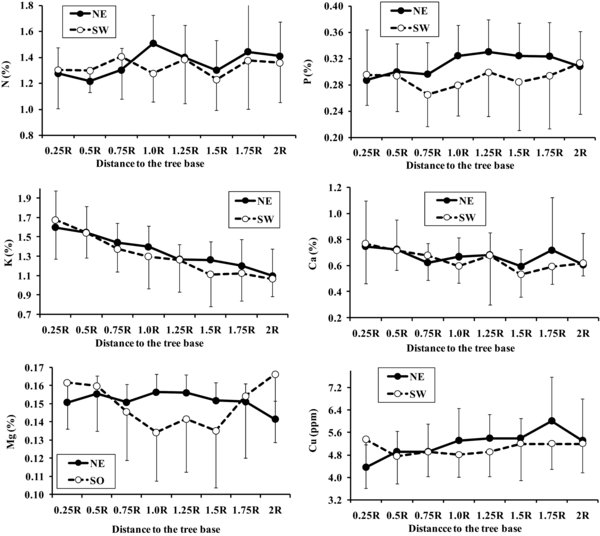
Spatial variation in plant nutrient content in year 2004: macronutrients and copper. Dots correspond to mean values whereas bars are standard deviations.
Spatial variation in plant nutrient content in year 2004: macronutrients and copper. Dots correspond to mean values whereas bars are standard deviations.