Free Access
Figure 3
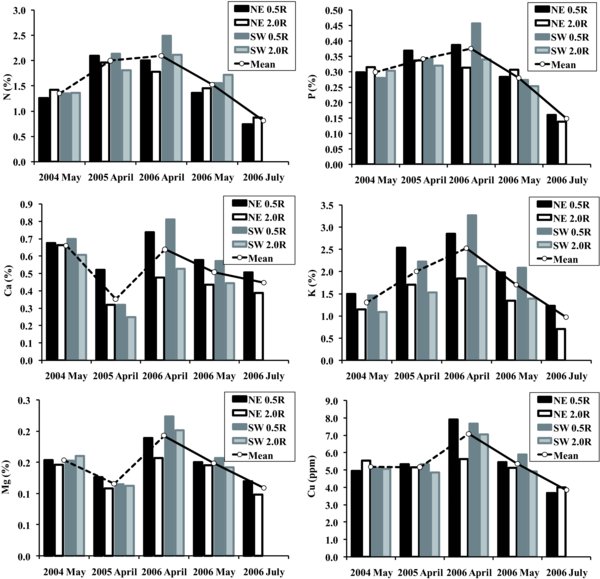
Temporal variation in plant macronutrient and Cu content. Solid lines depict the mean annual decline over the growing season in 2006. Dashed line serve as a reference for mean values in 2004 and 2005, where only one sampling was carried out.