Free Access
Figure 4
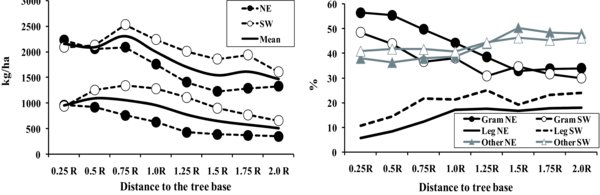
Average (data from 2004–2006) grassland yield (left graph) and composition (right graph) depending on the position with respect to the tree. Data are from Gea-Izquierdo et al. 2009. In the yield figure, upper graphs correspond to May results; whereas lower graphs correspond to April. Grassland composition: Gram = % graminae; Leg = % leguminosae; Other = % other botanical families.