Free Access
Figure 5
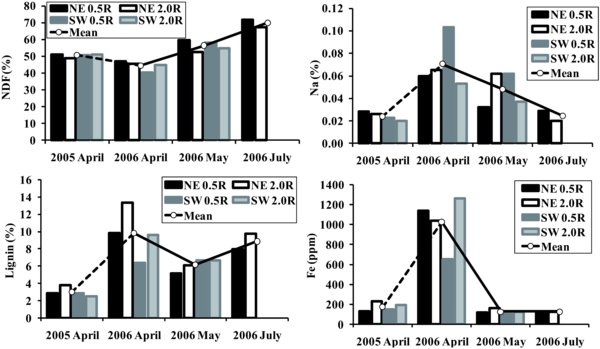
Temporal variation in plant micronutrient and pasture-related variables content. Solid lines depict the mean annual decline over the growing season in 2006. Dashed line serves as a reference for mean values in 2005, when only one sampling was carried out.