Free Access
Figure 1
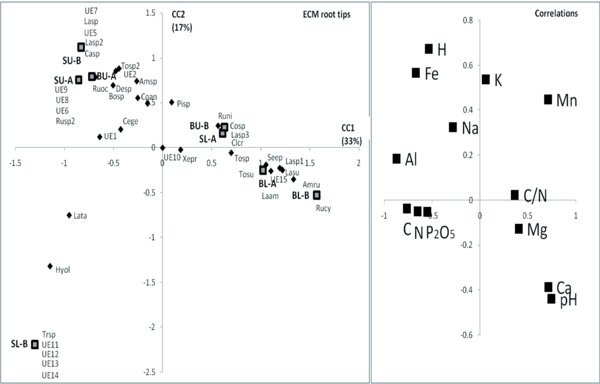
Canonical analysis based on the relative abundance of ECM root tips in each plot. Correlations: correlation circle between soil nutrient contents. ECM root tips: projection of the species and the 8 investigated plots on the plan of the two first canonical components. The first component (CC1) explained 33% of the total variance, and the second one (CC2) 17% (total: 50%). S: spruce, B: Beech, U: untreated, L: limed, A: replicate A, B: replicate B. The name of each species is abbreviated according to Table I.