Free Access
Figure 3
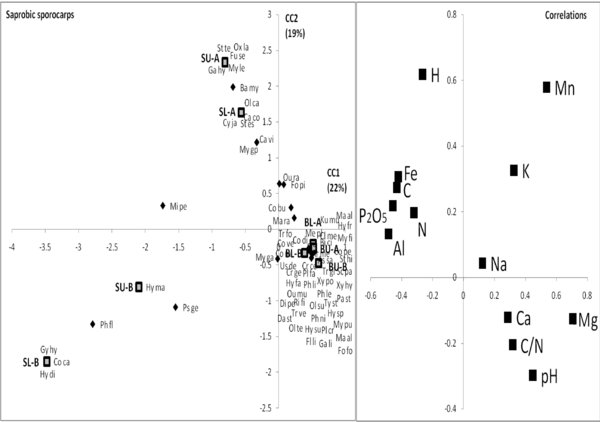
Canonical analysis based on the presence/absence of sporocarps of saprophytic species in each plot. Correlations: correlation circle between soil nutrient contents. ECM root tips: projection of the species and the 8 investigated plots on the plan of the two first canonical components. The first component (CC1) explained 22% of the total variance, and the second one (CC2) 19% (total: 41%). S: spruce, B: Beech, U: untreated, L: limed, A: replicate A, B: replicate B. The name of each species is abbreviated with the first two letters of its genus name, followed by a space and the first two letters of its species name (see also supplementary Tab. II).