Free Access
Figure 3
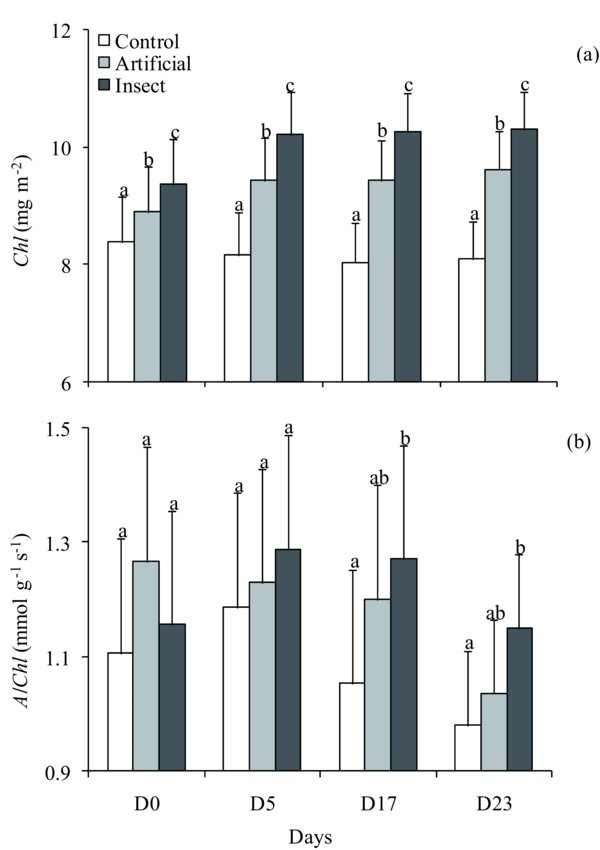
Mean (a) chlorophyll concentration (Chl) and (b) ratio between Amax and Chl (A/Chl) on four occasions (D0, D5, D17, D23) following defoliation treatments. Error bars show least square differences (α < 0.05). LSD homogeneous groupings are identified by letters (α = 0.05).