Free Access
Figure 5
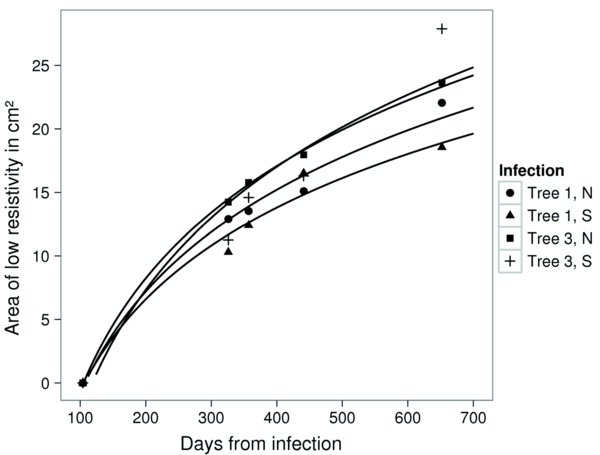
Areas of very low electric resistivity around the infected wounds of trees Nos. 1 and 3 measured 3, 10, 13 and 21 month after infection. Lines indicate results from a mixed effects model.
Areas of very low electric resistivity around the infected wounds of trees Nos. 1 and 3 measured 3, 10, 13 and 21 month after infection. Lines indicate results from a mixed effects model.