Free Access
Figure 2
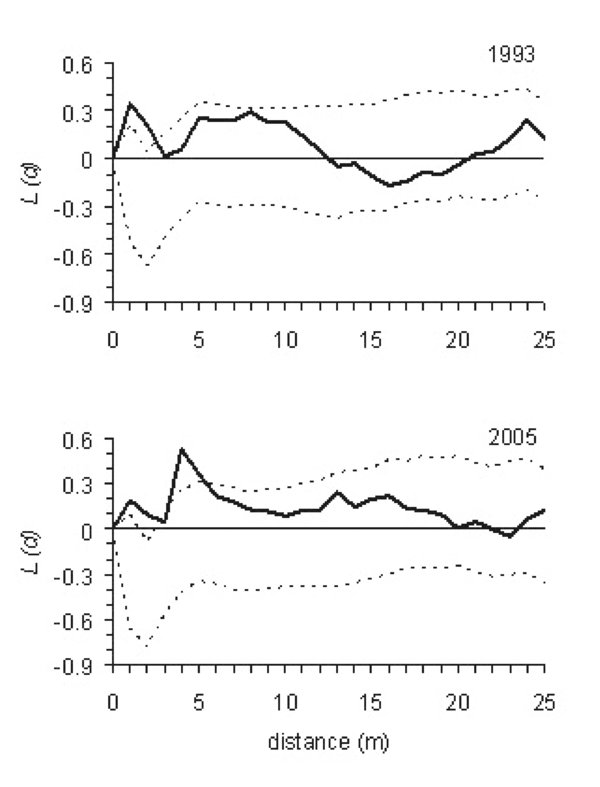
Bivariate Ripley’s K12 analysis in different periods tested against random labelling null hypothesis. The solid line represents L12 (d); the two broken lines represent the Monte Carlo envelope constructed at 99% confidence level. Values above confidence limit indicate positive spatial interactions between live trees and snags, whereas values below indicate negative spatial interactions. Analyses were performed from 1 to 50 m. Over 25 m functions did not diverge from null hypothesis, thus only results up to 25 m were shown.