Free Access
Figure 3
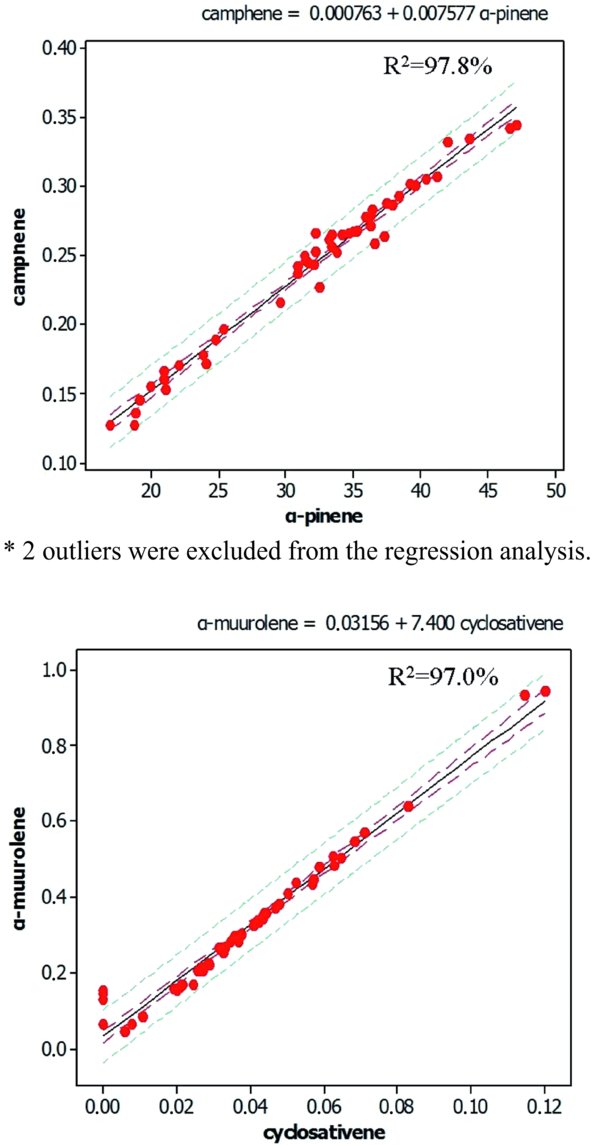
Regression plots between α-pinene and camphene (monoterpenes)* and α-muurolene and cyclosativene (sesquiterpenes). The correlation coefficients R2 and the regression equations are shown in the plots. The correlation coefficient (R2) is defined as the square of the Pearsons correlation coefficient r.