Free Access
Figure 1
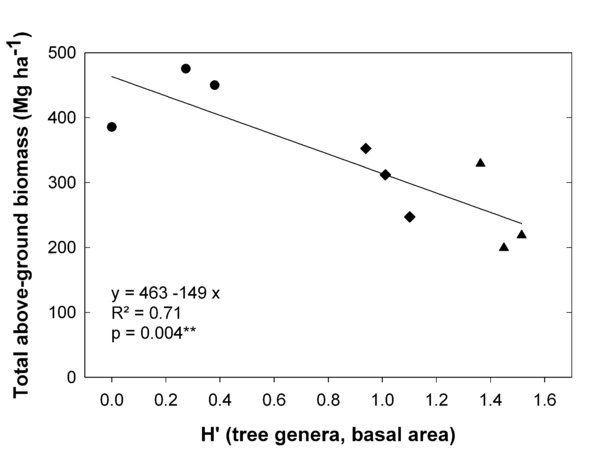
Relationship between total above-ground biomass (stem and branch wood, leaves, fruits) and the Shannon Index H′ of the tree layer (calculated from the basal area of all tree genera). N = 3 plots per diversity level. • DL 1; ♦ DL 2; ▴ DL 3.