Free Access
Figure 2
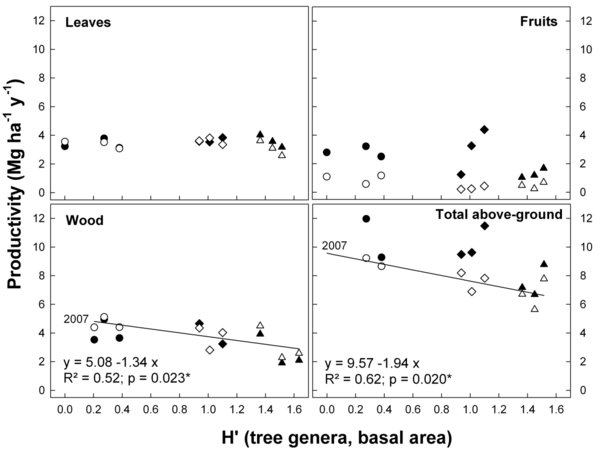
Productivity of leaves, fruits, wood and total above-ground biomass plotted against the Shannon Index H′ of the tree layer (calculated from the basal area of all tree genera). • DL 1; ♦ DL 2; ▴ DL 3. Data of 2006, closed symbols; data of 2007, open symbols.