Free Access
Figure 4
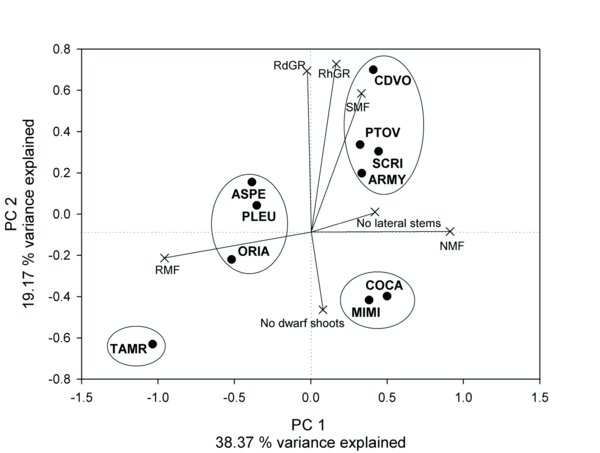
PCA results showing the factor coordinates of the variables (×) and populations (•) on the plane defined by the two Principal Components. A varimax rotation of the axes was performed. The ellipses denote the four different groups than can be defined according to the position of populations on the plane.