| Issue |
Ann. For. Sci.
Volume 67, Number 6, September 2010
|
|
|---|---|---|
| Article Number | 606 | |
| Number of page(s) | 8 | |
| DOI | https://doi.org/10.1051/forest/2010019 | |
| Published online | 08 July 2010 | |
Original article
Genetic variation and parental performance under inbreeding for growth in Eucalyptus globulus
1
Centro de Estudos Florestais, Departamento de Engenharia Florestal,
Instituto Superior de Agronomia, Universidade Técnica de Lisboa,
Tapada da Ajuda, 1349-017
Lisboa Codex,
Portugal
2
Centro de Matemática e Aplicações, Departamento de Matemática, Instituto
Superior Técnico, Universidade Técnica de Lisboa, Avenida Rovisco Pais, 1049-001
Lisboa, Portugal
3
University of Queensland, School of Land, Crop and Food
Sciences, St Lucia,
4072, Queensland, Australia
4
School of Plant Science and Cooperative Research Centre for Forestry,
University of Tasmania, Private Bag
55, Hobart, Tas.,
7001,
Australia
* Corresponding author:
This email address is being protected from spambots. You need JavaScript enabled to view it.
Received:
1
June
2009
Accepted:
21
December
2009
Abstract
• We aimed to better understand the genetic architecture of growth in E. globulus undergoing inbreeding by comparing families from selfing (SELF), open pollination (OP) and unrelated polymix crossing (POL) of common parents. Stem diameter at breast height (DBH) was assessed at 4, 6 and 10 years after planting in a field trial.
• The OP heritability was overestimated at an early age relative to the POL heritability.
• No significant correlations were found between the SELF and POL parental effects, indicating substantial non-additive genetic variation under inbreeding. The OP family effects were better correlated with the SELF than the POL population, and only at age 10 years, after substantial mortality of inbred progeny has occurred, was the positive correlation between OP and POL families significantly different from zero.
• The estimated dominance variance arising from inbreeding was nearly 10-fold greater than the dominance variance associated with random mating and the additive variance, and appeared to be a major contributor to the variation in inbreeding depression amongst selfed families.
Key words: Eucalyptus globulus / self-fertilization / mixed mating / inbreeding depression / genetic variance / heritability / breeding value
© INRA, EDP Sciences, 2010
1. INTRODUCTION
Inbreeding can lead to a reduction in the mean performance of a population, which is usually referred to as inbreeding depression (Lynch and Walsh, 1998). Inbreeding also complicates the genetic covariance structure of a population, introducing additional genetic parameters to express the covariance of relatives when compared with a random mating population (Cockerham, 1983; Harris, 1964). There are few studies comparing the quantitative genetic architecture of inbred and outbred populations (Edwards and Lamkey, 2002; Kelly and Arathi, 2003; Shaw et al., 1998), particularly in long-lived forest trees such as eucalypts (Hardner et al., 1996a; Resende and Vencovsky, 1992). This issue is important as most forest species are in the early stages of domestication, and many breeders are still exploiting open-pollinated seed collections from the wild (Eldridge et al., 1993). Indeed, the relative magnitude of the additive and non-additive genetic effects will be a key determinant of selection efficiency in the early phase of domestication.
A key question in estimating and utilising breeding values from open-pollinated trials is the extent to which variation between families reflects the additive genetic variation amongst the seed parents (Borralho, 1994). This was initially studied in Eucalyptus globulus by collection of both open-pollinated seed and pollen from the same wild trees, and then crossing these trees as male parents in a factorial mating design (Hodge et al., 1996). Subsequent studies using the trials established from this experiment showed significant positive genetic correlations between the additive genetic variation amongst the male parents with the open-pollinated female effects for traits under moderate to high additive genetic control, such as frost resistance (Volker et al., 1994), foliar disease damage (Dungey et al., 1997), wood density (Volker, 2002), the timing of the transition to adult foliage and first flowering (Jordan et al., 1999). However, this is not the case for growth (Hodge et al., 1996; Volker, 2002), a trait known to be under low additive genetic control in E. globulus (Costa e Silva et al., 2004; 2009; Li et al., 2007) and to exhibit severe inbreeding depression (Hardner and Potts, 1995; Hardner et al., 1998). This poor correlation is unlikely to be due to maternal effects (Lopez et al., 2003) and there is evidence in E. globulus (Hardner et al., 1996b), and other eucalypt species (Burgess et al., 1996; Hardner and Potts, 1997), that it may be partly explained by variation in outcrossing rates among parents. However, there is little understanding of the causal components of genetic variance for growth in inbred populations of E. globulus, and the extent to which variation in outcrossing rates is confounded with variation in non-additive genetic effects, including inbreeding depression, is unknown.
In the present study, we aim to better understand the genetic architecture of growth in E. globulus undergoing inbreeding. In particular, we attempt to provide an insight into the genetic basis of variation in inbreeding depression by looking at: (i) how open-pollinated progeny affects heritability estimation without proper accounting of inbreeding; (ii) whether inbreeding depression varies among parent trees; (iii) the extent to which family-level genetic effects in selfed and open-pollinated populations are correlated with the additive genetic effects in a non-inbred population; (iv) the causal components of genetic variation under inbreeding.
2. MATERIALS AND METHODS
E. globulus families were generated from selfing (SELF), open pollination (OP) and unrelated polymix crossing (POL) of common parents from a native population in south-eastern Tasmania, and planted in a field trial. SELF had 27 and 26 seed parents in common with OP and POL, respectively, and there were 48 parents in common between OP and POL. Details about the plant material, crossing design and trial layout used in this study have been described previously (Costa e Silva et al., 2010).
A linear mixed model incorporating heterogeneity of (co)variances among (fixed) cross types
for (random) family and residual effects was fitted to a data vector containing individual
tree measures of breast-height diameter (DBH) at ages 4, 6 or 10 years from planting (Costa
e Silva et al., 2010). Restricted maximum likelihood
(REML) estimates of (co)variance components were obtained by using the average information
REML algorithm, implemented in the ASReml software (Gilmour et al., 2006). Based on these observational variance components, narrow-sense
heritability estimates ( ) were obtained for the
POL and OP progenies with the general formula:
) were obtained for the
POL and OP progenies with the general formula:  (1)where r is the additive
relationship coefficient, and
(1)where r is the additive
relationship coefficient, and  and
and  are the estimated
between-family and phenotypic variances for a given cross type. In the first instance,
unadjusted heritabilities of the POL (
are the estimated
between-family and phenotypic variances for a given cross type. In the first instance,
unadjusted heritabilities of the POL ( ) and OP
(
) and OP
( ) progenies were
estimated using r = 0.25, assuming half-sib families and no inbreeding in
the founder parents. Then, adjusted heritability of the POL progeny (
) progenies were
estimated using r = 0.25, assuming half-sib families and no inbreeding in
the founder parents. Then, adjusted heritability of the POL progeny ( ) was estimated with
r = 0.29, calculated from (1 + f)/4, where
f = β/ (2 − β) is the equilibrium level
of inbreeding for a population undergoing mixed selfing and random mating in proportions
β and 1 − β (Cockerham and Weir, 1984), and assuming unrelated female parents and β = 0.3.
The values from OP were also
adjusted (
) was estimated with
r = 0.29, calculated from (1 + f)/4, where
f = β/ (2 − β) is the equilibrium level
of inbreeding for a population undergoing mixed selfing and random mating in proportions
β and 1 − β (Cockerham and Weir, 1984), and assuming unrelated female parents and β = 0.3.
The values from OP were also
adjusted ( ) using r = 0.4, calculated according to Squillace
(1974) by assuming unrelated parents,
β = 0.3, five equally effective local males per female parent (and
unrelated with the female parent) and no non-local pollen. An average outcrossing rate of
0.7 has been a common assumption in genetic analyses of E. globulus (Lopez
et al., 2002), and thus the use of β
= 0.3 has become a standard by which to compare values across studies.
For a given cross type, was calculated by
summing , the estimated
within-family variance and (when it was > 0) the variance due to the interaction
between replicates and families.
) using r = 0.4, calculated according to Squillace
(1974) by assuming unrelated parents,
β = 0.3, five equally effective local males per female parent (and
unrelated with the female parent) and no non-local pollen. An average outcrossing rate of
0.7 has been a common assumption in genetic analyses of E. globulus (Lopez
et al., 2002), and thus the use of β
= 0.3 has become a standard by which to compare values across studies.
For a given cross type, was calculated by
summing , the estimated
within-family variance and (when it was > 0) the variance due to the interaction
between replicates and families.
Estimates of family-level inbreeding depression (FIDk) from
selfing were obtained for DBH at each age as (see Moorad and Wade, 2005):  (2)where LSM(pol) –
LSM(self) is the mean inbreeding depression and, for the POL and SELF crosses,
LSM(pol) and LSM(self) are estimated least-squares means, and
(2)where LSM(pol) –
LSM(self) is the mean inbreeding depression and, for the POL and SELF crosses,
LSM(pol) and LSM(self) are estimated least-squares means, and
 and
and  pertain to effects of
the kth female parent. FIDk estimates from open
pollination (FIDk(op)) were obtained by substituting
LSM(self) with LSM(op) and with
pertain to effects of
the kth female parent. FIDk estimates from open
pollination (FIDk(op)) were obtained by substituting
LSM(self) with LSM(op) and with  in (2). Best linear
unbiased predictors (BLUPs) of female parental effects under the different cross types were
obtained by solving the mixed model equations. To compare FIDk
across ages, relative values of FIDk were calculated according
to Ågren and Schemske (1993) and Dudash et al. (1997). The variance among families in inbreeding
depression (
in (2). Best linear
unbiased predictors (BLUPs) of female parental effects under the different cross types were
obtained by solving the mixed model equations. To compare FIDk
across ages, relative values of FIDk were calculated according
to Ågren and Schemske (1993) and Dudash et al. (1997). The variance among families in inbreeding
depression ( ) from selfing was
estimated at a given age as:
) from selfing was
estimated at a given age as:  (3)where
  ,
,  and
and  are estimates of
between-family variances for POL and SELF, and covariance between POL and SELF progenies
related through a common female parent, respectively. Variation in family-level inbreeding
depression with open pollination was also estimated (
are estimates of
between-family variances for POL and SELF, and covariance between POL and SELF progenies
related through a common female parent, respectively. Variation in family-level inbreeding
depression with open pollination was also estimated ( ), by replacing
with
), by replacing
with  and
and  with
with  in (3). The variation in family-level inbreeding depression is
expected to be truly present when the variance amongst inbred progenies differs
significantly from that amongst outbred families (Kelly, 2005). Thus, the
in (3). The variation in family-level inbreeding depression is
expected to be truly present when the variance amongst inbred progenies differs
significantly from that amongst outbred families (Kelly, 2005). Thus, the  estimation (and related
FIDk(op) values) was not pursued for age 10, as
estimation (and related
FIDk(op) values) was not pursued for age 10, as
 was not significantly
different from for DBH at this age
(Costa e Silva et al., 2010). Standard errors of the
was not significantly
different from for DBH at this age
(Costa e Silva et al., 2010). Standard errors of the
 were calculated as the
square root of their sampling variances, obtained from the asymptotic matrix of sampling
(co)variances of the REML estimates for the terms included in (3).
were calculated as the
square root of their sampling variances, obtained from the asymptotic matrix of sampling
(co)variances of the REML estimates for the terms included in (3).
Correlations between cross types in family performance for DBH were calculated according to standard formulae (Lynch and Walsh, 1998), using REML estimates of between-family (co)variances. One-tailed likelihood ratio (LR) tests (Stram and Lee, 2004) were used to test whether the correlation estimated for a pair of cross types was significantly lower than one. Taylor series expansion was used to obtain approximate standard errors of the heritability and correlation estimates (Lynch and Walsh, 1998).
In a randomly mating population, the phenotypic variance of a trait can be defined as
VG + VE, with
VG = VA +
VD assuming no epistasis, where
VG, VA,
VD and VE are the total genetic,
additive genetic, dominance and environmental variances, respectively. Inbreeding changes
the population variance by introducing extra terms in VG, such
as (Cockerham, 1983; Harris, 1964): VDI, the variance due to homozygous
dominance deviations (i.e. dominance effects at loci where the allelic combinations are
identical by descent); COVADI, the covariance between the
additive effects of alleles and their homozygous dominance deviations; and
H * , the sum of squared inbreeding depression effects across
loci. The crossing design in our study does not include full-sib family relationships and
uses one level of controlled inbreeding only, and thus does not allow to separate the
dominance parameters VD, VDI and
H * . However, a simplification may be used to derive
VD and VDI by assuming that all
loci affecting the trait are biallelic, in which case VD =
H * , hence removing the need to estimate
H * (Cockerham and Weir, 1984). The genetic expectations of the REML (co)variance estimates for DBH are
(assuming linkage equilibrium, no epistasis and non-inbred founder parents):  (4)
(4) (5)
(5) (6)and (assuming VD =
H * , as mentioned above),
(6)and (assuming VD =
H * , as mentioned above),  (7)where
  and
and  are within-family
variance estimates, VE(self) and
VE(pol) are variances due to microenvironmental effects for
SELF and POL, respectively. If VE(self) =
VE(pol), then the linear combination in (7) is a function of
genetic effects only, which will allow deriving VA,
VD, COVADI and
VDI based on Equations (4) to (7). While it may be reasonable
to assume that environmental effects for SELF and POL may be similar for DBH at age 4, this
may not be the case at later ages due to the onset of canopy closure and the expected
development of competition (e.g. Hardner and Potts, 1997). In addition, as differences in survival between SELF and POL were
significant after age 4 (Costa e Silva et al., 2010),
it is expected that progenies from these cross types will differ in levels of response to
environmental effects after this earlier age. Hence, estimation of the genetic components of
variation was restricted to age 4.
are within-family
variance estimates, VE(self) and
VE(pol) are variances due to microenvironmental effects for
SELF and POL, respectively. If VE(self) =
VE(pol), then the linear combination in (7) is a function of
genetic effects only, which will allow deriving VA,
VD, COVADI and
VDI based on Equations (4) to (7). While it may be reasonable
to assume that environmental effects for SELF and POL may be similar for DBH at age 4, this
may not be the case at later ages due to the onset of canopy closure and the expected
development of competition (e.g. Hardner and Potts, 1997). In addition, as differences in survival between SELF and POL were
significant after age 4 (Costa e Silva et al., 2010),
it is expected that progenies from these cross types will differ in levels of response to
environmental effects after this earlier age. Hence, estimation of the genetic components of
variation was restricted to age 4.
3. RESULTS
Table I presents the values for DBH in the OP
and POL families, as well as  and
and  . The
FIDk(self) and FIDk(op) values for
DBH are provided in Appendices1 1 and 2, respectively;
general combining ability (GCA) estimates of the female parents and related rankings are
also shown in these appendices. Family correlations estimated between cross types are given
in Table II.
. The
FIDk(self) and FIDk(op) values for
DBH are provided in Appendices1 1 and 2, respectively;
general combining ability (GCA) estimates of the female parents and related rankings are
also shown in these appendices. Family correlations estimated between cross types are given
in Table II.
Estimated narrow-sense heritabilities and variances in family-level inbreeding depression for DBH, based on progeny data from three crossing designs – selfing (SELF), open pollination (OP) and outcrossing with a polymix (POL) – at different ages from planting. The approximate standard errors of the parameter estimates are given within parenthesis.
Estimated family correlations (with their approximate standard errors given within parenthesis) between different crossing designs for DBH at different ages from planting. The significance probabilities refer to one-tailed likelihood ratio tests applied to test the departure of the correlation estimates from one.
The heritability estimates based on OP decreased gradually with age, whereas the opposite
trend was observed for those from POL (Tab. I). At
age 4, the values from OP were 0.72
± 0.14 before adjustment and 0.45 ± 0.09 after adjustment, compared with corresponding
values of  and
and  from
POL. At age 6, there was a fairly good agreement between
from
POL. At age 6, there was a fairly good agreement between  and both
  and
and  ; in contrast, the
unadjusted
; in contrast, the
unadjusted  was almost twice as
large (i.e. 0.50 ± 0.12). At age 10, the values from OP were
lower (
was almost twice as
large (i.e. 0.50 ± 0.12). At age 10, the values from OP were
lower ( and
and  )
than those from POL (
)
than those from POL ( and
and
 ).
).
The  and
and  were similar at age 4,
but then
were similar at age 4,
but then  decreased from ages 4
to 6, while
decreased from ages 4
to 6, while  increased over time
(Tab. I). For both and
increased over time
(Tab. I). For both and  , the magnitude of the
estimates were larger than two times their standard errors at all ages except for
, the magnitude of the
estimates were larger than two times their standard errors at all ages except for
 at age 10. The high
mortality observed for SELF at 10 years (Costa e Silva et al., 2010) is likely to have affected the precision of
at age 10. The high
mortality observed for SELF at 10 years (Costa e Silva et al., 2010) is likely to have affected the precision of  at this age. Yet, in
general, the
at this age. Yet, in
general, the  appear to differ
significantly from zero, assuming asymptotic normality for the sampling distribution of the
parameter and considering that an estimate larger than two standard errors is statistically
significant at the 5% level. FIDk(self) ranged from 0.5 to 3.9
cm at age 4, from –0.2 to 4.4 cm at age 6, and from −1.0 to 5.3 cm at age 10
(Appendix11), indicating that the seed parents varied appreciably in their
degree of inbreeding depression. For FIDk(op), the ranges were −
0.4 to 3.4 cm at age 4, and −0.7 to 2.7 cm at age 6, with most of the parents having reduced
DBH growth in their OP offspring due to inbreeding (Appendix12). The relative
values of FIDk(self) and FIDk(op)
decreased with age for the majority of the parents, suggesting a gradual purging of
inbreeding depression over time in the SELF and OP progenies. There was no evident
relationship between FIDk and predictions of parental breeding
value for DBH: Pearson correlation coefficients with GCA ranged from –0.07 to 0.28 for
FIDk(self), and from 0.17 to 0.22 for
FIDk(op); none of these small correlations were significantly
different from zero at the 5% level. Conversely, Pearson correlation coefficients between
FIDk(self) and FIDk(op) from
common parents were 0.67 at age 4, and 0.75 at age 6, being both statistically significant
(P ≤ 0.001). The relationship between
FIDk(self) and FIDk(op) from
common parents is illustrated in Figure 1 for ages 4
and 6. Similar results were obtained with the relative values of
FIDk(self) and FIDk(op).
appear to differ
significantly from zero, assuming asymptotic normality for the sampling distribution of the
parameter and considering that an estimate larger than two standard errors is statistically
significant at the 5% level. FIDk(self) ranged from 0.5 to 3.9
cm at age 4, from –0.2 to 4.4 cm at age 6, and from −1.0 to 5.3 cm at age 10
(Appendix11), indicating that the seed parents varied appreciably in their
degree of inbreeding depression. For FIDk(op), the ranges were −
0.4 to 3.4 cm at age 4, and −0.7 to 2.7 cm at age 6, with most of the parents having reduced
DBH growth in their OP offspring due to inbreeding (Appendix12). The relative
values of FIDk(self) and FIDk(op)
decreased with age for the majority of the parents, suggesting a gradual purging of
inbreeding depression over time in the SELF and OP progenies. There was no evident
relationship between FIDk and predictions of parental breeding
value for DBH: Pearson correlation coefficients with GCA ranged from –0.07 to 0.28 for
FIDk(self), and from 0.17 to 0.22 for
FIDk(op); none of these small correlations were significantly
different from zero at the 5% level. Conversely, Pearson correlation coefficients between
FIDk(self) and FIDk(op) from
common parents were 0.67 at age 4, and 0.75 at age 6, being both statistically significant
(P ≤ 0.001). The relationship between
FIDk(self) and FIDk(op) from
common parents is illustrated in Figure 1 for ages 4
and 6. Similar results were obtained with the relative values of
FIDk(self) and FIDk(op).
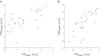 |
Figure 1 Relationship between estimates of family-level inbreeding depression from selfing (FIDk(self)) and open pollination (FIDk(op)) from common parents at ages 4 (A) and 6 (B) years from planting. Pearson correlation coefficients between FIDk(self) and FIDk(op) were 0.67 at age 4, and 0.75 at age 6, being both statistically significant (P ≤ 0.001). |
The family correlation estimates between cross types differed significantly (P ≤ 0.001) from one in all cases except for the pair SELF/OP at age 10 (Tab. II). Parental effects estimated from SELF tended to be highly correlated with corresponding effects from OP. Conversely, the POL families were in general poorly correlated with either SELF or OP progenies from the same parent. However, the correlation among parent effects from OP and POL improved over time: indeed, two-tailed LR tests indicated that the correlation estimate among families from these cross types was significantly (P ≤ 0.05) different from zero at age 10, a result that was not detected at previous ages (not shown). For SELF and POL, none of the family correlation estimates differed significantly from zero (P > 0.05, not shown).
For DBH expressed under selfing, and using the relationships given in equations (4) to (7),
the estimated genetic components of variation at age 4 were  ,
,  ,
,  and
and  ,
indicating that the variance due to homozygous dominance effects was noticeably larger than
the estimates associated with other non-additive terms and additive effects, which appear to
be similar. Estimates of components of genetic variation under inbreeding, derived from the
resemblance among inbred and outbred relatives, are typically associated with large sampling
variances unless prohibitively large sample sizes are used (Kelly, 1999). Nevertheless, for
,
indicating that the variance due to homozygous dominance effects was noticeably larger than
the estimates associated with other non-additive terms and additive effects, which appear to
be similar. Estimates of components of genetic variation under inbreeding, derived from the
resemblance among inbred and outbred relatives, are typically associated with large sampling
variances unless prohibitively large sample sizes are used (Kelly, 1999). Nevertheless, for  and
and  , the magnitude of the
estimates exceeded their standard errors by more than two times, suggesting that they differ
significantly from zero. Conversely, for
, the magnitude of the
estimates exceeded their standard errors by more than two times, suggesting that they differ
significantly from zero. Conversely, for  and
and  , the standard errors
were large compared with the magnitude of the estimates, and thus these could be the result
of sampling error.
, the standard errors
were large compared with the magnitude of the estimates, and thus these could be the result
of sampling error.
4. DISCUSSION
4.1. Narrow-sense heritabilities
For growth traits in Eucalyptus spp., overestimation of heritabilities
based on OP progeny relative to estimates derived from controlled crosses may be due to
several causes, such as mixture of inbred and outbred individuals within families,
population-level inbreeding depression, and heterogeneous self-pollination rates and/or
inbreeding depression amongst families (Borralho, 1994; Hodge et al., 1996). At ages 4 and
6, the unadjusted appeared to be
noticeably biased upwards (Tab. I), indicating that
the assumption of a half-sib family structure (r = 0.25) for the OP
offspring was not valid at these ages. Squillace’s (1974) correction of the mean coefficient of additive relationship to adjust
applies an average
self-pollination rate assumed for the base population, but does not consider the
population-level inbreeding depression and the differential inbreeding depression that may
occur among OP families. Using r = 0.4 was not sufficient to remove the
upward bias in at age 4. Even when
assuming a high value such as β = 0.5, the use of Squillace’s (1974) method could not correct for the overestimation
in at age 4 (not shown).
Indeed, at age 4, inbreeding depression in the OP population had its highest magnitude
(i.e. 10%) for DBH, and  had its greatest
level of inflation relative to
had its greatest
level of inflation relative to  (Costa e Silva et
al., 2010). The later suggests a larger differential
inbreeding depression among OP families at age 4, consistent with the greater
(Costa e Silva et
al., 2010). The later suggests a larger differential
inbreeding depression among OP families at age 4, consistent with the greater
 value presented in
Table I. Yet, these events were attenuated at age
6, in which case Squillace’s (1974) procedure was
effective for reducing the bias in the .
value presented in
Table I. Yet, these events were attenuated at age
6, in which case Squillace’s (1974) procedure was
effective for reducing the bias in the .
4.2. Variation in family-level inbreeding depression
The inflation of  in SELF or OP
relative to POL, as reported in Costa e Silva et al. (2010), reflects the heterogeneity in inbreeding depression amongst the SELF or
OP families, as quantified by
in SELF or OP
relative to POL, as reported in Costa e Silva et al. (2010), reflects the heterogeneity in inbreeding depression amongst the SELF or
OP families, as quantified by  (Tab. I). Assuming a model based on rare recessive
deleterious alleles, Moorad and Wade (2005) showed
that low values of the average degree of dominance (h), referring to
increased dominance deviations in heterozygotes and increased mean inbreeding depression,
provided more variation in family-level inbreeding depression than did high values of
h. In particular, for partially recessive alleles with
h = 0.2,
(Tab. I). Assuming a model based on rare recessive
deleterious alleles, Moorad and Wade (2005) showed
that low values of the average degree of dominance (h), referring to
increased dominance deviations in heterozygotes and increased mean inbreeding depression,
provided more variation in family-level inbreeding depression than did high values of
h. In particular, for partially recessive alleles with
h = 0.2,  after one generation
of selfing (see Eq. (8) of Moorad and Wade, 2005);
this approaches
after one generation
of selfing (see Eq. (8) of Moorad and Wade, 2005);
this approaches  and
and  that can be
estimated for DBH at age 4 in the present study. These results suggest that the expression
of deleterious alleles that are rare and partially recessive is likely to be a major
source of inbreeding depression in DBH. There was also a prevailing pattern amongst female
parents for a decrease in relative FIDk values with age
(Appendices11 and 2). This indicates that, through purging of partially
deleterious recessive alleles, dominance rather than overdominance underlies the
expression of inbreeding depression (Dudash et al., 1997), although avoiding competition among cross types in the field trial may
have also contributed to reduce the differences between SELF (or OP) and POL at a later
age (Costa e Silva et al., 2010). With lower
h, the contribution of additive genetic effects to
that can be
estimated for DBH at age 4 in the present study. These results suggest that the expression
of deleterious alleles that are rare and partially recessive is likely to be a major
source of inbreeding depression in DBH. There was also a prevailing pattern amongst female
parents for a decrease in relative FIDk values with age
(Appendices11 and 2). This indicates that, through purging of partially
deleterious recessive alleles, dominance rather than overdominance underlies the
expression of inbreeding depression (Dudash et al., 1997), although avoiding competition among cross types in the field trial may
have also contributed to reduce the differences between SELF (or OP) and POL at a later
age (Costa e Silva et al., 2010). With lower
h, the contribution of additive genetic effects to  will gradually be
reduced and, with complete dominance (i.e. h = 0), nearly all
will gradually be
reduced and, with complete dominance (i.e. h = 0), nearly all
 will be generated by
non-additive genetic variation (in which case is much greater than
VA; Moorad and Wade, 2005).
will be generated by
non-additive genetic variation (in which case is much greater than
VA; Moorad and Wade, 2005).
Comparable in the SELF and OP
populations at age 4 (Tab. I), coupled with a
positive correlation between the FIDk(self) and
FIDk(op) of common parents (Fig. 1), argues that the variation in non-additive effects arising from
inbreeding per se (i.e. rather than variation in outcrossing rate) may be
the main driver of the variation in performance amongst OP families in early growth. From
a deployment perspective, it is clear that unless outcrossing rates are high in
open-pollinated seed orchards, the severe effects of inbreeding depression may counter any
additive genetic gains in growth made through parental selection. This risk has led to the
development of systems for mass production of control-pollinated seed of E.
globulus (Potts et al., 2008). These
systems have the potential to exploit non-additive genetic effects of both random and
inbred origin. However, given the deleterious effects of inbreeding in E. globulus
and the magnitude of the variance in family-level inbreeding depression relative
to the additive genetic variance (as indicated above), the major initial gain is likely to
be from the avoidance of inbreeding arising from the species’ mixed mating system.
4.3. Family correlations between cross types
The performance of selfed families could not provide a reliable indicator of the parental
GCA for DBH, as indicated by the poor family correlation estimates between the SELF and
POL cross types (Tab. II). This corroborates the
mode of gene action suggested from the magnitude of the  / ratios (Costa e
Silva et al., 2010) and
/ ratios (Costa e
Silva et al., 2010) and  values (Tab. I), in that correlations among family effects from
selfed and outcrossed progenies are expected to be low if non-additive genetic variance
contributes substantially to genetic variation under inbreeding. Thus, during the initial
stages of domestication, the use of selfs for progeny testing may not be an adequate
strategy for selecting superior parents for outcross growth in E.
globulus.
values (Tab. I), in that correlations among family effects from
selfed and outcrossed progenies are expected to be low if non-additive genetic variance
contributes substantially to genetic variation under inbreeding. Thus, during the initial
stages of domestication, the use of selfs for progeny testing may not be an adequate
strategy for selecting superior parents for outcross growth in E.
globulus.
Parental effects estimated from the OP offspring were in general well correlated with the
selfed performance, and thus tended to be also poor indicators of GCA. Strategies to raise
the accuracy of parental effects obtained from OP progeny include accounting for native
stand structure (Borralho and Potts, 1996), only
sampling seed at high levels in the tree canopies (where outcrossing rates are greater and
more homogeneous, Patterson et al., 2001), as well
as a direct estimation of outcrossing rates (Burgess et al., 1996). However, these strategies cannot account for the inherent
variation in the genetic factors giving rise to inbreeding depression which vary between
OP families of E. globulus. Nevertheless, the present study indicated
that the correlation between a parent’s OP and POL progeny performance increased over time
(Tab. II), suggesting that deleterious alleles may
have been purged in the OP progeny during the course of the experiment, which is supported
at age 10 by an insignificant population-level inbreeding depression due to open
pollination and by similar and values (Costa e
Silva et al., 2010). Thus, although it may not be
effective at earlier ages, open pollination may become a useful method for progeny testing
for growth as field trials get older and OP family effects turn to be more reliable
predictors of parental breeding values. Yet, this may be achieved at the expense of a
reduction in genetic gain per unit of time, which may limit the use of family selection
based on OP progeny as a breeding tool in E. globulus. This limitation
does not appear to apply to the non-growth traits studied to date (see Introduction).
4.4. Genetic variation under inbreeding
The combined effects of dominance and inbreeding lead to the inclusion of five genetic
components in the covariance between self relatives. Of the three genetic components –
VDI, COVADI and
H * – that are a direct consequence of inbreeding, only
COVADI can be negative depending on the gene frequencies and
dominance effects (Cockerham, 1983; Cockerham and
Weir, 1984). The present study indicated that
had a major
contribution to the estimated genetic variation under inbreeding in this population. In
particular, the much smaller contribution of  compared to
 appears despite the significant (P ≤ 0.001) and
high (i.e. 21%) population-level inbreeding depression due to selfing that was detected
for DBH at age 4 (Costa e Silva et al., 2010). Yet,
while apparently not significant, was comparable to
appears despite the significant (P ≤ 0.001) and
high (i.e. 21%) population-level inbreeding depression due to selfing that was detected
for DBH at age 4 (Costa e Silva et al., 2010). Yet,
while apparently not significant, was comparable to
 , consistent with
results obtained in growth traits by Li et al. (2007) for non-inbred populations of E. globulus. Results from
other studies with quantitative traits have indicated that significant inbreeding
depression was generally accompanied by an important contribution of estimated
VDI to genetic variation, but not always by significant
estimates of VD and/or
COVADI (Kelly and Arathi, 2003; Shaw et al., 1998). The significant inbreeding depression due to selfing together with the
substantial , as found here for DBH at age 4, indicate that the homozygous
dominance effects may be strongly directional at loci influencing the trait, so that
inbreeding increases genetic variance while decreasing significantly the trait mean.
, consistent with
results obtained in growth traits by Li et al. (2007) for non-inbred populations of E. globulus. Results from
other studies with quantitative traits have indicated that significant inbreeding
depression was generally accompanied by an important contribution of estimated
VDI to genetic variation, but not always by significant
estimates of VD and/or
COVADI (Kelly and Arathi, 2003; Shaw et al., 1998). The significant inbreeding depression due to selfing together with the
substantial , as found here for DBH at age 4, indicate that the homozygous
dominance effects may be strongly directional at loci influencing the trait, so that
inbreeding increases genetic variance while decreasing significantly the trait mean.
Results reported by Moorad and Wade (2005)
indicated that VDI may be a major contributor to variation in
inbreeding depression amongst selfed families. In particular, for partial dominance with
rare alleles, VDI ≈
11VA and VDI
≈ 5VA for average degrees of dominance (h) of
0.15 and 0.20, respectively (see Eq. (7), Moorad and Wade, 2005). This range of values includes  , which can be
calculated from the genetic components estimated for DBH at age 4, and thus giving another
indication that deleterious alleles that are rare and partially recessive are likely to be
important in inducing inbreeding depression for this trait. In addition, for
h values varying from 0.15 to 0.20, rare alleles may make a substantial
greater contribution to VDI than to
COVADI, as suggested from the work of Moorad and Wade (2005). Negative COVADI may
appear when partially recessive deleterious alleles with frequencies similar to or greater
than 0.5 are also contributing to inbreeding depression in a trait (Kelly, 1999; Resende and Vencovsky, 1992). This may be also the case for DBH at age 4, as suggested by the
negative sign of
, which can be
calculated from the genetic components estimated for DBH at age 4, and thus giving another
indication that deleterious alleles that are rare and partially recessive are likely to be
important in inducing inbreeding depression for this trait. In addition, for
h values varying from 0.15 to 0.20, rare alleles may make a substantial
greater contribution to VDI than to
COVADI, as suggested from the work of Moorad and Wade (2005). Negative COVADI may
appear when partially recessive deleterious alleles with frequencies similar to or greater
than 0.5 are also contributing to inbreeding depression in a trait (Kelly, 1999; Resende and Vencovsky, 1992). This may be also the case for DBH at age 4, as suggested by the
negative sign of  . Yet, given its poor
precision, the estimate obtained here for COVADI may be due to
sampling error, and thus we cannot exclude the possibility that the actual value of this
parameter is close to zero.
. Yet, given its poor
precision, the estimate obtained here for COVADI may be due to
sampling error, and thus we cannot exclude the possibility that the actual value of this
parameter is close to zero.
The magnitudes of VDI and COVADI are expected to affect the response to selection for improving a trait in a population undergoing inbreeding, as they may aggravate the depressing effect of inbreeding on the trait mean. In particular, if COVADI is negative, then the higher the additive effect of an allele, the higher will be its contribution to inbreeding depression caused by homozygous dominance deviations. In this sense, in a population undergoing inbreeding, selection towards the increase of the frequency of high-valued alleles could also increase inbreeding depression in the next generations, and thus delay genetic progress. This could offset the potential benefits of strategies using selfing as a breeding tool, which may enable rare recessive alleles with major deleterious effects to be eliminated in early generations of breeding (Williams and Savolainen, 1996). For populations undergoing mixed mating, Shaw et al. (1998) reported that, together with a large and significant estimate for VDI, even small, negative estimates of COVADI reduced the expected response to selection much more than could be accounted for by inbreeding depression alone; the reduction was somewhat greater for higher selfing rates. Thus, for E. globulus OP populations, the impact of COVADI and/orVDI on selection response may be appreciable given the moderate values found for average outcrossing rates under open pollination (Mimura et al., 2009). Resende and Vencovsky (1992) also reported that the advantage of selection based on progeny testing of selfed families (after one generation of selfing) over half-sibs increased as populations became more improved, which was due to the negative COVADI at intermediate to low frequencies of the favourable alleles.
5. CONCLUSION
OP heritability estimates for DBH growth decreased with time, while an opposite trend was observed in the POL population, indicating that the presence of inbreds and associated non-additive genetic variance in the OP population may have biased upwards the estimated OP heritability at an early age.
There was virtually no correlation between selfed families and additive genetic effects of the seed parent for DBH growth, indicating the presence of large non-additive genetic effects due to inbreeding. In addition, this study showed that estimates of parental effects for DBH from OP progenies, particularly those derived from native stand seed collections, are likely to be of poor accuracy and full pedigree control will be required for their accurate estimation. Nevertheless, our results also suggested that, after allowing for the mortality of inbred individuals in the OP offspring, it is possible that later age trial measurements may better correlated to the additive genetic effects in the population.
An estimated component of genetic variance due to dominance effects resulting from inbreeding appeared to be a major contributor to the variation in inbreeding depression amongst selfed families. Indeed, the estimated variance due to homozygous dominance deviations for DBH growth under selfing was nearly 10-fold greater than the dominance variance associated with random mating and the additive variance. The importance of this dominance variance due to inbreeding may reflect the build up of a genetic load of rare deleterious alleles in the central parts of the species range.
Online material
General combining ability (GCA) estimates of female parents, parental rankings (according to the GCA) and estimates of family-level inbreeding depression (FIDk) due to selfing (SELF) for DBH at different ages from planting. The results pertain to the 26 parents that are represented in both the SELF and Polymix (POL) cross types.
General combining ability (GCA) estimates of female parents, parental rankings (according to the GCA estimates) and family-level inbreeding depression (FIDk) due to open pollination (OP) for DBH at ages 4 and 6 from planting. The results pertain to the 48 parents that are represented in both the OP and Polymix (POL) cross types.
Acknowledgments
We thank Gunns Ltd for provision of the trial site, Paul Tilyard for data collection and management. Funding for crossing and trial establishment was provided by the CRC for Temperate Hardwood Forestry. Trial measurements were supported by the CRC for Sustainable Production Forestry and CRC for Forestry. The financial support given by Fundação para a Ciência e Tecnologia (Lisboa, Portugal) through the Ciência 2007 initiative to the senior author and by the Australian Research Council (BMP) is gratefully acknowledged.
Appendices are available online only at www.afs-journal.org.
References
- Ågren J. and Schemske D.W., 1993. Outcrossing rate and inbreeding depression in two annual monoecious herbs, Begonia hirsuta and B. semiovata. Evolution 47: 125–135. [CrossRef] [PubMed] [Google Scholar]
- Borralho N.M.G., 1994. Heterogeneous selfing rates and dominance effects in estimating heritabilities from open-pollinated progeny. Can. J. For. Res. 24: 1079–1082. [CrossRef] [Google Scholar]
- Borralho N.M.G. and Potts B.M., 1996. Accounting for native stand characteristics in genetic evaluations of open-pollinated progeny from Eucalyptus globulus base population. New For. 11: 53–64. [Google Scholar]
- Burgess I.P., Williams E.R., Bell J.C., Harwood C.E. and Owen J.V., 1996. The effect of outcrossing rate on the growth of selected families of Eucalyptus grandis. Silvae Genet. 45: 97–101. [Google Scholar]
- Cockerham C.C., 1983. Covariances of relatives from self-fertilization. Crop Sci. 23: 1177–1180. [CrossRef] [Google Scholar]
- Cockerham C.C. and Weir B.S., 1984. Covariances of relatives stemming from a population undergoing mixed self and random mating. Biometrics 40: 157–164. [CrossRef] [PubMed] [Google Scholar]
- Costa e Silva J., Borralho N.M.G. and Potts B.M., 2004. Additive and non-additive genetic parameters from clonally replicated and seedling progenies of Eucalyptus globulus. Theor. Appl. Genet. 108: 1113-1119. [CrossRef] [PubMed] [Google Scholar]
- Costa e Silva J., Borralho N.M.G., Araújo J.A., Vaillancourt R.E. and Potts B.M., 2009. Genetic parameters for growth, wood density and pulp yield in Eucalyptus globulus. Tree Genet. Genomes 5: 291-305. [CrossRef] [Google Scholar]
- Costa e Silva J., Hardner C.M., Tilyard P., Pires A.M., and Potts B.M., 2010. Effects of inbreeding on population mean performance and observational variances in Eucalyptus globulus, Ann. For. Sci. 67: 605. [CrossRef] [EDP Sciences] [Google Scholar]
- Dudash M.R., Carr D.E. and Fenster C.B., 1997. Five generations of enforced selfing and outcrossing in Mimulus guttatus. Inbreeding depression variation at the population and family level. Evolution 51: 54–65. [Google Scholar]
- Dungey H.S., Potts B.M., Carnegie A.J. and Ades P.K., 1997. Mycosphaerella leaf disease: Genetic variation in damage to Eucalyptus nitens, E. globulus and their F1 hybrid. Can. J. For. Res. 27: 750–759. [CrossRef] [Google Scholar]
- Edwards J.W. and Lamkey K.R., 2002. Quantitative Genetics of Inbreeding in a synthetic maize population. Crop Sci. 42: 1094–1104. [CrossRef] [Google Scholar]
- Eldridge K., Davidson J., Harwood C., and van Wyk G., 1993. Eucalypt domestication and breeding. Clarendon Press, Oxford, UK. [Google Scholar]
- Gilmour A.R., Gogel B.J., Cullis B.R., and Thompson R., 2006. ASReml User Guide Release 2.0. VSN International Ltd, Hemel Hempstead, UK. [Google Scholar]
- Hardner C.M. and Potts B.M., 1995. Inbreeding depression and changes in variation after selfing Eucalyptus globulus subsp. globulus. Silvae Genet. 44: 46-54. [Google Scholar]
- Hardner C.M. and Potts B.M., 1997. Postdispersal selection following mixed mating in Eucalyptus regnans. Evolution 51: 103-111. [CrossRef] [PubMed] [Google Scholar]
- Hardner C.M., Borralho N.M.G., Tier B., Miller S., and Goddard M., 1996a. Accounting for dominance and inbreeding in genetic evaluations using individual tree mixed models. In: Dieters M.J., Matheson A.C., Nikles D.G., Harwood C.E., and Walker S.M. (Eds.), Tree Improvement for Sustainable Tropical Forestry, Proceedings QFRI-IUFRO Conference, 27 October – 1 November 1996, Caloundra, Queensland, Australia. Queensland Forest Research Institute, Caloundra, Queensland, pp. 143–147. [Google Scholar]
- Hardner C.M., Vaillancourt R.E. and Potts B.M., 1996. Stand density influences outcrossing rate and growth of open-pollinated families of Eucalyptus globulus. Silvae Genet. 45: 226–228. [Google Scholar]
- Hardner C.M., Potts B.M. and Gore P.L., 1998. The relationship between cross success and spatial proximity of Eucalyptus globulus ssp. globulus parents. Evolution 52: 614–618. [CrossRef] [PubMed] [Google Scholar]
- Harris D.L., 1964. Genotypic covariances between inbred relatives. Genetics 50: 1319–1348. [PubMed] [Google Scholar]
- Hodge G.R., Volker P.W., Potts B.M. and Owen J.V., 1996. A comparison of genetic information from open-pollinated and control-pollinated progeny tests in two eucalypt species. Theor. Appl. Genet. 92: 53–63. [CrossRef] [PubMed] [Google Scholar]
- Jordan G., Potts B.M. and Wiltshire R., 1999. Strong, independent quantitative genetic control of vegetative phase change and first flowering in Eucalyptus globulus ssp. globulus. Heredity 83: 179–187. [CrossRef] [PubMed] [Google Scholar]
- Kelly J.K., 1999. An experimental method for evaluating the contribution of deleterious mutations to quantitative trait variation. Genet. Res. 73: 263–273. [CrossRef] [PubMed] [Google Scholar]
- Kelly J.K., 2005. Family level inbreeding depression and the evolution of plant systems. New Phytol. 165: 55–62. [CrossRef] [PubMed] [Google Scholar]
- Kelly J.K. and Arathi H.S., 2003. Inbreeding and the genetic variance of floral traits in Mimulus guttatus. Heredity 90: 77–83. [CrossRef] [PubMed] [Google Scholar]
- Li Y., Dutkowski G.W., Apiolaza L.A., Pilbeam D.J., Costa e Silva J. and Potts B.M., 2007. The genetic architecture of a Eucalyptus globulus full-sib breeding population in Australia. For. Genet. 12: 167–179. [Google Scholar]
- Lopez G.A., Potts B.M., Dutkowski G.W., Apiolaza L.A. and Gelid P.E., 2002. Genetic variation and inter-trait correlations in Eucalyptus globulus base population trials in Argentina. For. Genet. 9: 217–231. [Google Scholar]
- Lopez G.A., Potts B.M., Vaillancourt R.E. and Apiolaza L.A., 2003. Maternal and carryover effects on early growth of Eucalyptus globulus. Can. J. For. Res. 33: 2108–2115. [CrossRef] [Google Scholar]
- Lynch M. and Walsh B., 1998. Genetics and Analysis of Quantitative Traits, Sinauer Associates, Sunderland, MA, USA. [Google Scholar]
- Mimura M., Barbour R.C., Potts B.M., Vaillancourt R.E. and Watanabe K.N., 2009. Comparison of contemporary mating patterns in continuous and fragmented Eucalyptus globulus native forests. Mol. Ecol. 18: 4180–4192. [CrossRef] [PubMed] [Google Scholar]
- Moorad J.A. and Wade M.J., 2005. A genetic interpretation of the variation in inbreeding depression. Genetics 170: 1373–1384. [CrossRef] [PubMed] [Google Scholar]
- Patterson B., Vaillancourt R.E. and Potts B.M., 2001. Eucalypt seed collectors: beware of sampling seed lots from low in the canopy! Aust. For. 64: 139–142. [Google Scholar]
- Potts B.M., McGowen M.H., Williams D.R., Suitor S., Jones T.H., Gore P.L. and Vaillancourt R.E., 2008. Advances in reproductive biology and seed production systems of Eucalyptus: The case of Eucalyptus globulus. Southern Forests 70: 145–154. [CrossRef] [Google Scholar]
- Resende M.D.V. and Vencovsky R., 1992. Numerical evaluation of the relative efficiency of Eucalyptus selection methods based on half-sib and selfed families. I. Progeny testing. In: Lambeth C.C. and Dvorak W. (Eds.), Resolving Tropical Forest Resource Concerns Through Tree Improvement, Gene Conservation and Domestication of New Species, Proceedings IUFRO Conference, Group S2.02-08, Breeding Tropical Trees, Cartagena and Cali, Colombia, pp. 261–269. [Google Scholar]
- Shaw R.G., Byers D.L. and Shaw F.H., 1998. Genetic components of variation in Nemophila menziesii undergoing inbreeding: morphology and flowering time. Genetics 150: 1649–1661. [PubMed] [Google Scholar]
- Squillace A.E., 1974. Average genetic correlations among offspring from open-pollinated forest trees. Silvae Genet. 23: 149–156. [Google Scholar]
- Stram D.O. and Lee J.W., 1994. Variance components testing in the longitudinal mixed effects model. Biometrics 50: 1171–1177. [CrossRef] [PubMed] [Google Scholar]
- Volker P.W., 2002. Quantitative Genetics of Eucalyptus globulus, E. nitens and their F1 Hybrid. Unpublished Ph.D. thesis, School of Plant Science, University of Tasmania, Hobart. [Google Scholar]
- Volker P.W., Owen J.V. and Borralho N.M.G., 1994. Genetic variances and covariances for frost tolerance in Eucalyptus globulus and E. nitens. Silvae Genet. 43: 366–372. [Google Scholar]
- Williams C.G. and Savolainen O., 1996. Inbreeding depression in conifers: implications for breeding strategy. For. Sci. 42: 102–117. [Google Scholar]
All Tables
Estimated narrow-sense heritabilities and variances in family-level inbreeding depression for DBH, based on progeny data from three crossing designs – selfing (SELF), open pollination (OP) and outcrossing with a polymix (POL) – at different ages from planting. The approximate standard errors of the parameter estimates are given within parenthesis.
Estimated family correlations (with their approximate standard errors given within parenthesis) between different crossing designs for DBH at different ages from planting. The significance probabilities refer to one-tailed likelihood ratio tests applied to test the departure of the correlation estimates from one.
General combining ability (GCA) estimates of female parents, parental rankings (according to the GCA) and estimates of family-level inbreeding depression (FIDk) due to selfing (SELF) for DBH at different ages from planting. The results pertain to the 26 parents that are represented in both the SELF and Polymix (POL) cross types.
General combining ability (GCA) estimates of female parents, parental rankings (according to the GCA estimates) and family-level inbreeding depression (FIDk) due to open pollination (OP) for DBH at ages 4 and 6 from planting. The results pertain to the 48 parents that are represented in both the OP and Polymix (POL) cross types.
All Figures
|
Figure 1 Relationship between estimates of family-level inbreeding depression from selfing (FIDk(self)) and open pollination (FIDk(op)) from common parents at ages 4 (A) and 6 (B) years from planting. Pearson correlation coefficients between FIDk(self) and FIDk(op) were 0.67 at age 4, and 0.75 at age 6, being both statistically significant (P ≤ 0.001). |
| In the text | |