Free Access
Figure 2
Download original image
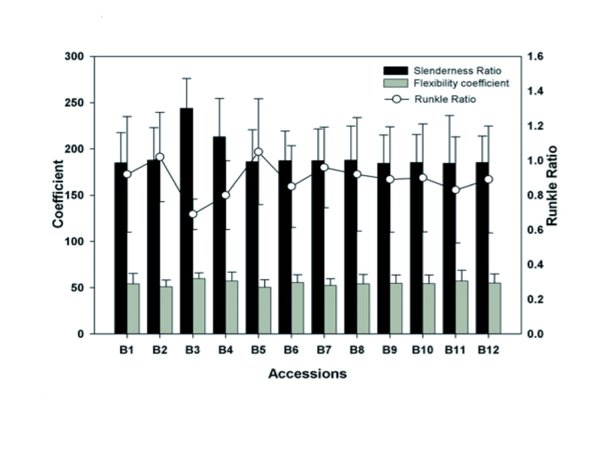
Variations in slenderness ratios (value in Y1 axis, left), flexibility coefficients (Y1 axis) and Runkel ratios (Y2 axis, right) among representative accessions of B. balcooa from 12 locations. The data shown are average values, with standard error from the mean ( ± SEM) indicated as an uncertainty bar.