Free Access
Supplementary Figure S2
Download original image
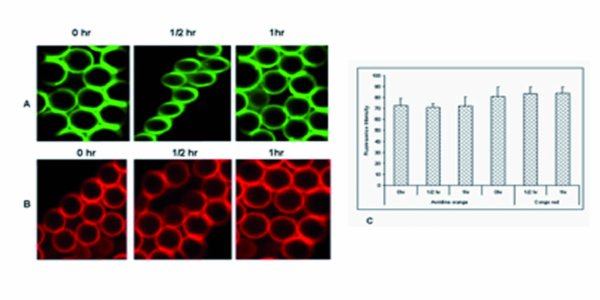
Images of fluorescent beads at different time intervals, used as internal controls for AO-stained samples (A) and CR-stained images (B). Graphical representation of the fluorescence intensity values of CR- and AO-stained beads acquired by CLSM during the experimental period, showing consistency. Images of fluorescent beads and fluorescence intensity values depict the stability of laser illumination during the image acquisition period.