Free Access
Figure 4
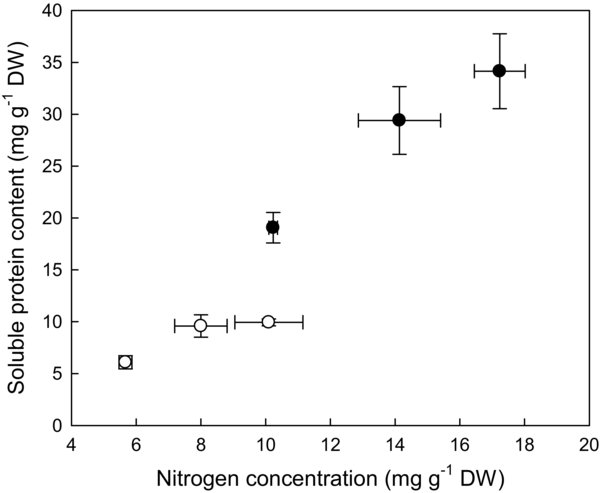
Relationship between mass-based total soluble protein content and mass-based nitrogen concentration of leaves (black-filled circles) and current-year stems (open circles) of Fagus sylvatica L. Each point corresponds to the mean value of each N treatment and mean value of protein content (n = 3 for each ones). The standard errors of the ordinate and abscissa values are shown as vertical and horizontal bars, respectively.