Open Access
Figure 1
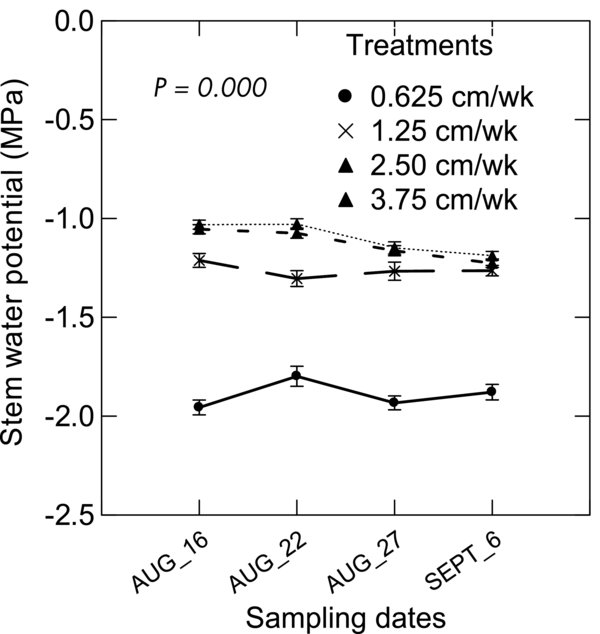
Stem water potential of as response to irrigation treatment. The graph indicate that plants irrigated at 3.75 and 2.50 cm/wk were exposed to similar water stresses while 1.25 cm/wk and 0.625 cm/wk were exposed to higher water stress levels. The data was analyzed by repeated measures ANOVA and was highly significant at P = 0.000 with α = 0.01.