| Issue |
Ann. For. Sci.
Volume 67, Number 6, September 2010
|
|
|---|---|---|
| Article Number | 602 | |
| Number of page(s) | 9 | |
| DOI | https://doi.org/10.1051/forest/2010015 | |
| Published online | 08 July 2010 | |
Original article
Morphology and foliar chemistry of containerized Abies fraseri (Pursh) Poir. seedlings as affected by water availability and nutrition
1
Department of Forestry, Michigan State University,
126 Natural Resources Building,
East Lansing, Michigan
48824, USA
2
Department of Horticulture and Department of Forestry, Michigan State
University, A214 Plant and Soil Sciences Building, East Lansing, Michigan
48824, USA
* Corresponding author:
This email address is being protected from spambots. You need JavaScript enabled to view it.
Received:
14
July
2009
Accepted:
8
December
2009
Abstract
• We present the results of a two-year (2007–2008) greenhouse study investigating the effect of water availability and nitrogen fertilization on the growth, biomass partitioning, and foliar nutrient content of Abies fraseri (Pursh) Poir.
• Fertilizer and moisture content (irrigation) were varied in a factorial experiment combining four levels of irrigation and three levels of fertilization to evaluate growth and foliar nutrient content. In addition, a numerical optimization was used to estimate appropriate levels of each factor necessary to achieve simulated goals for response variables.
• Irrigation increased the height growth by 12 to 35% depending on the fertilization treatment (p = 0.0001). Fertilization increased height growth by 10 to 26% (p = 0.02). A similar response was observed for stem diameter growth (SDG). Total biomass accumulation increased as result of positive response of stem and root biomass development, and foliar nitrogen content was positively affected by nitrogen fertilization and negatively affected by irrigation. The numerical optimization for simulated target growth and nitrogen content responses produced levels of input combinations with high desirability factors to achieve the target responses.
• These results suggest that nutrient addition is a strong determining factor for early development of this species. The improved growth efficiency in this study is likely attributed to a combination of factors including, improved photosynthetic capacity, decreased stomatal limitations, or increased resource allocation to stems.
Key words: Abies fraseri / biomass / water stress / foliar nitrogen / nutrient uptake
© INRA, EDP Sciences, 2010
1. INTRODUCTION
The production of nursery trees has increased steadily in the United States in recent years rising from 3.3 to 4.6 billion dollars in value between 2000 and 2006 (USDA, 2007). From that value, coniferous evergreens represented 0.5 billion dollar for a total production of 48 thousand plants in 2006, of which 59% were produced in containers (USDA, 2007). In this production system, regular fertilization is necessary to supply the plant’s nutrient requirements (Bilderback, 1999), and irrigation is provided to supply the water needed for growth and to fulfill physiological functions (Groves et al., 1998; McDonald, 1984). In addition to the genetic potential, growth and productivity of crops grown in containers are mostly affected by nitrogen fertilizer application (Miller and Timmer, 1994). However, growth and productivity can also be affected by many other factors including: container type and size, tray cell density pattern, substrate quality, fertilization application, and irrigation regime (Derby and Hinesley, 2005; Tilt et al., 1987; Worrall et al., 1987). These factors all affect growth individually, but constant interactions among them add to the effect of individual factors. Among these potential interactions, the combination of fertilizer and irrigation plays a critical role (McDonald, 1984; Oliet et al., 2004; 2005; van den Driessche et al., 2003).
Moisture availability and nutrient uptake are closely linked because nutrient movement in the soil and plant tissues depends on appropriate moisture content. Plant moisture stress may reduce transpiration rates and permeability of roots, thereby reducing mass flow and uptake of elements (Brown and van den Driessche, 2002). For instance, in some deciduous broadleaf tree species, water stress reduces uptake of calcium and magnesium less than that of nitrogen, phosphorus, and potassium (Sands and Mulligan, 1990). Also, the uptake of boron is sharply reduced under moisture stress (Marschner, 1986). Sheriff et al. (1986) observed that higher concentrations of phosphorus and nitrogen were both accompanied with higher water use efficiency by the foliage in Pinus radiata (D. Don), improving the photosynthetic ability of the plant. Furthermore, proper irrigation can increase fertilizer uptake efficiency and nutrient accumulation due to both the increased mass flow during transpiration and increased diffusion in the soil (Marschner, 1986). A study of nutrient uptake in Loblolly pine (Pinus taeda L.) indicated that combining irrigation and fertilization resulted in greater nutrient uptake efficiency compared to fertilization only treatments (Albaugh et al., 2008).
Research groups in Europe and North America have had an increased interest in investigating the combined effect of fertilization and irrigation and their impact on productivity and physiology. Trichet et al. (2008) evaluated the growth, biomass allocation, and canopy closure of maritime pine (Pinus pinaster Aït.) under various nutrient and water treatments and found increases in above ground biomass of up to 58% in combined treatments compared to control plots. Large increases in stem volume were also obtained on a 10-year old stand of Radiata pine (Pinus radiata) in Australia (Snowdon and Benson, 1992). In the southeastern United States, combining appropriate levels of fertilizers and irrigation resulted in 100% and 150% increases in leaf area index and current annual stem volume increment (Albaugh et al., 2004; Trichet et al., 2008). Increasing the rate of fertilization at the transplant stage can accelerate the shoot and root growth of the plant and modify the nutrient content of tissues, therefore increasing the amount of available reserves (Grossnickle, 2000). This, in turn, improves post-transplant rooting and growth capacity, and increases resistance to water stress, temperature variations and diseases (Grossnickle, 2000). Coyle et al. (2008) evaluated the above-ground biomass accumulation and distribution of three species, and reported that sweetgum (Liquidambar styraciflua L.) responded positively to irrigation and fertilization with additive responses to irrigation and fertilization, while pine only responded to fertilization. Samuelson et al. (2008) focused on loblolly pine in the southern United States and reported mixed results; fertigation increased foliar nitrogen concentration and foliage biomass, but had no effect on leaf physiological parameters or growth efficiency.
Most investigations focusing on tree performances as affected by fertilization and irrigation have largely targeted field plantations and there is limited information available for container stocks. Consequently, to better meet current and future growth needs of container grown stocks, several important issues need to be better understood. Plant growth potential as related to fertilization, irrigation, and their interaction needs to be quantified and analyzed. Additionally, understanding biomass and nutrient partitioning among various organs will lead to better management of fertilization and irrigation. Lastly, the ability to predict average growth based on input management will allow for an efficient planning of silvicultural treatments, tree rotation, and harvesting. Such information is becoming critical for the nursery and ornamental industries as the proportion of trees grown under controlled environments for this industry rises. In addition to the evaluation of individual and combined effects of these factors, this study also involves a numerical optimization for each factor necessary to achieve simulated goals for the various response variables.
The objective of this study was to investigate the effects of fertilization and irrigation on growth and biomass productivity of containerized Abies fraseri. Nutrient uptake and partitioning in above and below ground organs was also investigated.
2. METHODS
2.1. Site and materials
This two-year greenhouse study was conducted at the tree research center (TRC) at Michigan State University. In the winter and spring of 2007 and 2008, greenhouse temperature highs averaged about 22 °C, and lows averaged about 17 °C, with a mean daytime operating temperature around 20 °C. In the summer of 2007 and 2008, highs averaged around 27 °C and lows around 20 °C, with a daytime operating temperature of about 25 °C.
Three-year-old (plug+2) Fraser fir (Abies fraseri) transplants were potted in 11.6 L cylindrical black plastic containers. The seedlings initially averaged 0.93 mm in diameter and 31.4 cm in height, 47.96 g in total biomass and a shoot to root ratio of 2.21. The potting mix was the Fafard 52 mix (Conrad Fafard, Inc.), which contains approximately 60% pine bark along with Canadian sphagnum peat, perlite, vermiculite, dolomitic limestone and gypsum. Fafard 52 is slightly acidic with a pH of 5.5–6.5.
The fertilizer used was a slow-release, granular ammonium sulfate formulation MESATM from Lebanon Turf (Lebanon, PA). The fertilizer is coated with methylene urea, resulting in increased nitrogen concentration in the final formulation that contains 30% nitrogen (30-0-0), and 12% sulfur.
Prior to potting, the seedlings were root pruned to an approximate root length of 25 cm. Seedlings were potted at root-collar depth on May 19, 2007 and placed in the greenhouse where they received various treatments throughout the growing season (described below) until September 30, 2007. At that date, all plants were moved outdoors to a lathouse for hardening and dormancy. The lathouse was covered with a polyurethane tarp throughout the winter to protect seedlings from extreme winter temperatures, and desiccation winds. On April 15, 2008 (before bud break), plants were moved back into the greenhouse for another growing season.
2.2. Design
The experiment was a factorial design with 3 fertilization levels (28 kg/ha, 56 kg/ha, and 112 kg/ha) and 4 irrigation levels (0.625, 1.25, 2.50, and 3.75 cm/week). Each treatment had 9 pots and was replicated 3 times for a total of 27 seedlings for each treatment.
2.3. Treatment
The fertilizer rates (28 kg/ha, 56 kg/ha, and 112 kg/ha) were pro-rated to the surface area of containers to determine application rates for each treatment. Using this method, application rates of 6 g, 12 g, and 18 g (actual N) were applied for each of the tree field rates indicated above. Irrigation volumes were calculated in a similar manner and application volumes of 386, 257, 122, and 63 ml/pot/day determined to be correspondent to target rates of 3.75, 2.5, 1.25, and 0.625 cm/week under field conditions. The variation in plant stress in each watering treatment was determined by measuring stem water potential variation using a plant water status console model 3115 (Soil Moisture Equipment, Corp. Santa Barbara, CA) at four different dates in 2007 (Fig. 1). Stem potential measurement indicated that plants receiving 3.75 and 2.5 cm/week were under similar stress levels, while plants exposed to 1.25 and 0.625 cm/week were under higher moisture stress (Fig. 1). The proper amount of ammonium sulfate fertilizer for each treatment was applied as top dress in a single yearly application at the beginning of each of the two growing seasons. Irrigation was manually applied daily five days a week (Monday through Friday) between 2 p.m. and 5 p.m. using specially designed volumetric containers for each treatment. For the 2008 growing season, similar fertilization and irrigation treatments were applied.
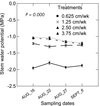 |
Figure 1 Stem water potential of as response to irrigation treatment. The graph indicate that plants irrigated at 3.75 and 2.50 cm/wk were exposed to similar water stresses while 1.25 cm/wk and 0.625 cm/wk were exposed to higher water stress levels. The data was analyzed by repeated measures ANOVA and was highly significant at P = 0.000 with α = 0.01. |
2.4. Measurements
Height from the soil surface and stem diameter (directly above root collar), was measured in May 2007 on all samples for baseline data shortly after the experimental set up was completed. Trees were re-measured at the end of the 2007 (September 11) and 2008 (September 17) seasons, and annual height and diameter growth were calculated as the difference between the final and initial measurements. Other morphological attributes evaluated included total terminal leader length, viable leader bud count and terminal bud cluster. Leader height and bud count were used to calculate the leader bud density (LBD) as the total number of buds (viable leader buds) divided by the current year’s length of the leader. Stem diameter and total tree height were measured with a digital caliper and leader growth was measured with a ruler. The height growth was converted to relative height growth (RHG) by dividing each seasonal change in height by the initial height.
Stem diameter growth (SDG) was calculated as follows as the difference between the root colar diameter at the end and the beginning of the season for each seedling. No conversion was made of the SDG data because of the low variability observed in diameter values at the beginning of the experiment.
At the end of the 2008 growing season, two random specimens were collected from each replicate (6 specimens total per treatment) to determine final biomass for each treatment. Biomass accumulation for stems, roots, and foliage were calculated as the difference between the final and initial biomass for each treatment. Growth efficiency was calculated as the ratio of stem to foliage biomass accumulation of the two years of the study
2.5. Nutrient Sampling and analysis
Foliage tissue samples from three seedlings per treatment and replicate (108 in total) were collected once a month for digestion and analysis. Tissue samples were dried at 65 °C in the oven until constant weight, and ground before digestion with a mixture of sulfuric acid (4.5%) and hydrogen peroxide (1.5%).
Nitrogen and phosphorus content was determined colorimetrically by wet chemistry using a San++ segmented flow analyzer (Skalar, Inc.). Foliage, root and stem tissues from the final biomass sampling described above were also acid digested and analyzed for their nitrogen and phosphorus content. The total nitrogen and phosphorus concentration in each of the three organs was determined as the product of the measured concentration for each tissue type and the total measured biomass for that organ.
2.6. Data Analysis
Morphological attributes, biomass, and nutrient content data were first tested for
homogeneity of variance and normality. To achieve homogeneity and normality of residuals,
a natural log transformation of the height growth and a square root transformation of
diameter growth and leader bud density were necessary. A general factorial model combining
main effects and interaction as described in Equation (1) was used.  (1)where β0 is the
model intercept, βn is the coefficient
associated with factor n, and the letters A and
B represent the factors in the model. The combination of factors (such
as AB) represents an interaction between the individual terms in that
factor, and ε is the error term. The model is in fact a multiple
regression model with an interaction and error terms. Analysis of variance (ANOVA) was
performed for a 3 × 4 factorial design with three replications on all response variables
using the linear model described above. During the study, all containers were arranged on
greenhouse benches. Therefore, no blocking effect was included into the analysis and all
treatment effects considered fixed (no random effect). A level of significance of
α = 0.05 was used for inferring any statistical significance.
(1)where β0 is the
model intercept, βn is the coefficient
associated with factor n, and the letters A and
B represent the factors in the model. The combination of factors (such
as AB) represents an interaction between the individual terms in that
factor, and ε is the error term. The model is in fact a multiple
regression model with an interaction and error terms. Analysis of variance (ANOVA) was
performed for a 3 × 4 factorial design with three replications on all response variables
using the linear model described above. During the study, all containers were arranged on
greenhouse benches. Therefore, no blocking effect was included into the analysis and all
treatment effects considered fixed (no random effect). A level of significance of
α = 0.05 was used for inferring any statistical significance.
The model regression is done in coded units derived from actual units according the
following coded Eq. (2).  (2)The coding reduces the range of each factor
to a common scale, generally −1 to +1, regardless of its relative magnitude (Myers and
Montgomery, 1995). This is necessary when factors
vary in scales that are different from each other
(2)The coding reduces the range of each factor
to a common scale, generally −1 to +1, regardless of its relative magnitude (Myers and
Montgomery, 1995). This is necessary when factors
vary in scales that are different from each other
A numerical optimization was performed to determine the optimal combination of irrigation and fertilization treatments to achieve target height growth and foliar nitrogen content for each year of the study. The process optimizes any combination of either factors or responses within preset goals, which can be either to minimize, maximize, target or within a range. The method makes use of an objective function, D(X), called the desirability function, which reflects the desirable ranges for each response (di). The desirable ranges are from zero to one (least to most desirable respectively). The higher the desirability index, the more likely the proposed combination of treatments will achieve the set target response (Myers and Montgomery, 1995).
The experimental design and all statistical analysis and numerical optimization were done using Design-Expert 7.1.3 from Stat-Ease, Inc. (Minneapolis, MN).
3. RESULTS
3.1. Growth measurements
The data for the growth response variables to irrigation and fertilization treatments for 2007 and 2008 are summarized in Figure 2. Height growth varied from 4.46 to 10.62 cm and 3.63 to 8.73 cm in 2007 and 2008 respectively (Fig. 2). Stem diameter growth (SDG) varied from 2.37 to 3.98 mm and 1.23 and 3.10 mm in 2007 and 2008 respectively (Fig. 2). Data analysis indicated that irrigation increased height growth from 12 to 35%, and SDG up to 54% (lowest to highest irrigation treatment). Fertilization effect on height and SDG was also positive with height increases varying from 10 to 26%, while SDG increases varied from 4 to 32% (lowest to highest fertilization treatment).
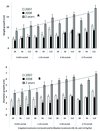 |
Figure 2 Height (A) and diameter (B) growth as response to irrigation and fertilization treatments. The cummulative growth indicates a linear response to irrigation. |
Statistical significance levels (ANOVA) of Fraser fir response variables after 2 y treatment with various irrigation and fertilization treatments.
Analysis of variance (Tab. I) of the various response variables, indicates that irrigation and fertilization increased RHG in both years (p < 0.05), but the interaction between the two factors was not significant in either year suggesting no added effect due to the interaction of the two factors. SDG positively responded to irrigation in 2007 and 2008 (p = 0.003 and p = 0.000 respectively). The response to fertilizers application was positive in 2007 (p = 0.016), but not significant in 2008 (p = 0.071). Similar to height growth, there was no significant interaction between irrigation and fertilization treatments in either both year (p = 0.263 and p = 0.908). Leader bud density response to irrigation was also mixed with significant response in 2007 (p = 0.000) and non significant response in 2008 (p = 0.332). The response to fertilizer treatments was significant for both 2007 (p = 0.015) and 2008 (p = 0.042). The interaction between irrigation and fertilization was significant in both years (p = 0.015 and p = 0.049) for 2007 and 2008 respectively.
3.2. Biomass accumulation and partitioning
 |
Figure 3 Allocation of biomass accumulation as affected by irrigation (IRR) and fertilization treatments. |
The two-year biomass accumulation (Fig. 3) indicates that total biomass generally increased with irrigation treatments from 40 g to 110 g/tree depending on the fertilization treatment. Higher fertilization treatments (56 kg/ha and 112 kg/ha) generally produced higher biomass accumulation, especially when combined with high irrigation treatments (2.5 cm/wk and 3.75 cm/wk).
The partition of the accumulated biomass indicates that needle biomass accumulation did not increase with higher irrigation and fertilization treatments, but roots and stem biomass accumulation were generally positively affected by both factors.
Both irrigation and fertilization significantly increased growth efficiency (stem growth per unit of leaf biomass), with results indicating greater efficiency with combination of 2.5 cm/week and 3.75 cm/week and 112 kg/ha of fertilization (Fig. 4).
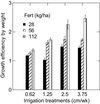 |
Figure 4 Growth efficiency calculated as the ratio of stem to foliage biomass accumulation as affected by irrigation and fertilization treatments. |
3.3. Foliar nutrient content
Foliar N content was affected by irrigation in 2007 (p = 0.001) but not in 2008 (p = 0.176). The N content was significant affected by fertilization in both 2007 (p = 0.010) and 2008 (p = 0.006). However, the interaction of both treatments (Tab. I) did not have any significant effects on foliar N content (p = 0.385 in 2007, and p = 0.444 in 2008).
Foliar P content was significantly affected by both irrigation (p = 0.037) and fertilization (p = 0.002) treatments in 2007, but not in 2008 (p = 0.094 and p = 0.251 respectively). However, the interaction between the two treatment factors was not significant in 2007 (p = 0.072), but significant in 2008 (p = 0.021).
3.4. Numerical optimization
Numerical optimization settings and results for annual height growth response variable.
The data presented for 2007 (Tab. II) indicated that the combination of 3.75 cm/wk irrigation and 28 kg/ha fertilization was the best option with a predicted growth of 9.09 cm and a di of 0.91. The next two best solutions were 2.5 cm/wk irrigation and 56 kg/ha fertilization for a growth response of 8.81 and a di of 0.88, and 3.75 cm/wk irrigation and 56 kg/ha fertilization for a growth response of 7.38 and a di of 0.74. For the 2008 height growth (Tab. III), the best solution combined 2.5 cm/wk of irrigation and 112 kg/ha of fertilization for a growth of 9.98 cm and a di of 0.99.
Numerical optimization settings and results for the 2007 foliar nitrogen content.
A similar approach was used for the target foliar nitrogen content of 180 ppm for 2007 and 2008 (Tab. III). In 2007, the best solution was 1.5 cm/wk of irrigation and 28 kg/ha of fertilization with an N content of 179.1 ppm and a di of 0.99. In 2008 the best solution was achieved with 1.25 cm/wk of irrigation and 112 kg/ha of fertilization generating an N content of 178.9 ppm and a di of 0.99.
4. DISCUSSION
4.1. Effect of resource availability on growth
This study provides an assessment of growth dynamics due to irrigation and fertilizer treatments in container grown transplants. Our results indicate that both irrigation and fertilization were limiting factors for height growth, but there was no significant interaction between the two factors. Stem diameter growth responded positively to irrigation in both years and to fertilization in 2007, but not in 2008. Biomass accumulation (Fig. 3) also responded positively to irrigation and fertilization applications. These conclusions are in agreement with previous studies related to growth, volume, and biomass production as related to fertilization and irrigation in various conifers species under field conditions (Nilsson and Orlander, 2003; Snowdon and Benson, 1992; Trichet et al., 2008). Maintaining high soil moisture in highly irrigated plots allows stomata to remain opened longer resulting in more volume growth (Albaugh et al., 2008). This physiological process leads to increased production of carbohydrates due to enhancedphotosynthesis and explains the strong height, radial growth, and biomass growth response observed in this study. Previous studies manipulating nutrients and water levels have shown that increased height, diameter, and volume production were the result of improved production of photosynthates generated by greatly increased leaf area due to the establishment of non-limiting conditions based on irrigation and fertilization (Albaugh et al., 2004; Bergh et al., 1999). Past studies focused on the new growth of established trees, and the response occurred mainly in new shoots leading to the proposition that this was a reflection of withdrawal and retranslocation of resources to sinks of new growth (Malik and Timmer, 1998; McAlister and Timmer, 1998; Xu and Timmer, 1999). However, these processes studied under field conditions and on the new growth of established trees are not necessarily applicable to first or second year transplants, or containerized plants. Consequently, the biomass partitioning data from this study (Fig. 4) showing no change in foliage biomass accumulation does not support this hypothesis. In our study, the increase in accumulated total biomass was the result of changes in stem biomass and root biomass accumulations (Fig. 3). These results are in line with Albaugh et al. (2004) who reported 119% and 23% increases in stem mass as result of fertilization and irrigation respectively. During this early stage of plant development, increases in water and nutrient availability are positive for establishment and growth, but resource allocation is directed towards establishment especially via the production of fine roots (Coyle and Coleman, 2005). Enhanced root growth and well developed root systems are of critical importance for the future survival of containerized plants once transplanted in the field. Under field conditions, moisture is required to optimize the fertilizer response (Coyle et al., 2008). However, the availability of the nutrients in the soil alone will not determine tree growth and biomass allocation. Nutrient uptake from the soil and translocation to various organs is also a key factor in biomass partitioning. Appropriate soil moisture is necessary for optimal uptake of ions from the soil to the various plant organs either through mass flow or diffusion. However this is a secondary factor in relating the importance of water for plant growth (Hsiao, 1973). The uptake rate and partitioning is affected by several environmental, hormonal, and genetic factors that can act concomitantly to determine the final plant response to various treatments. Plants allocate available resources to build an absorptive system (roots) that will be able to match the transpirational demand of the shoot. This has been demonstrated in numerous early studies indicating that various species will develop optimal shoot/root ratios under various conditions (Walker, 2001).
The numerical optimization analysis provided mixed results. The 2007 data indicates that optimal growth can be obtained with appropriate irrigation and low levels of fertilization, however, the best solutions were obtained with high irrigation and high fertilization in 2008. The reasons for this difference between the two years are unknown. However, the fact that high irrigation was necessary for both years underlines the importance of high soil moisture content for optimal ionic fluxes in the nutrient uptake process.
4.2. Effect on resource availability on foliar nutrient content and growth efficiency
Compared to published standards for containerized conifers (Landis et al., 1989), all foliar N and P concentrations found in this study were generally within range of nutrient sufficiency despite a wide variation attributed to the efficiency of nutrient uptake and nutrient dynamics in the system. Increased resource availability positively affected foliar N and P. The direct effect of nitrogen applications was the increased foliar nitrogen content. However, an indirect effect was the increased P content. This illustrates that there was sufficient P supply in the potting medium for Abies fraseri transplants. The fact that both foliar N and P were positive suggests a synergetic interaction between N applications, soil P content, and nutrient uptake. However, further studies with more controlled N and P fertilization treatments are necessary to confirm this hypothesis. The strong response to fertilization treatments shows that nutrient addition is a determining factor for early development in production of this species. The marginal effect of irrigation and lack of interaction between foliar N and P and irrigation may have been caused by the high rate of leaching observed in high irrigation treatments. The response to the addition of water and nutrients can be variable and depends on seasonal site water balance and initial soil fertility (Jonard et al., 2009; Trichet et al., 2008). Therefore, increased water addition through irrigation is likely to lead to soil saturation and cause a flow-through of highly mobile nutrients present in the soil solution such as nitrates below the root zone.
The numerical optimization indicated that the input combination needed to achieve a nominal target foliar N response was not necessarily the one with the highest N fertilization and irrigation treatment. This further suggests that optimal nutrient uptake and fertilization efficiency can only be achieved by synchronizing the fertilization application, soil moisture content, and nutrient demand of the plant at each growth stage.
Growth efficiency (Fig. 4) indicates improved efficiency with increased fertilization and irrigation. Previous studies of the growth efficiency of fertilizer loblolly pine and slash pine found sustained increases (Albaugh et al., 2004) or increases that disappeared as the stand grew older (Jokela and Martin, 2000; Will et al., 2002). Improvements in biomass growth efficiency observed in this study can be attributed to improvements in photosynthetic abilities and a decrease in stomatal limitation due to the effect of water stress (Trichet et al., 2008). Positive changes in growth efficiency can also be attributed to increases in the rate of carbon fixation per unit of leaf biomass due to changes in resource allocation in favor of the stem, or increases in the rate of photosynthesis compared to respiration (Cobb et al., 2008).
5. CONCLUSION
The growth of container Abies fraseri transplant seedlings was increased by the combination of increased moisture and nitrogen fertilization. Increases in accumulated biomass were the result of positive changes in stem and root biomass accumulations. We hypothesized that this was the result of a resource partitioning process favoring establishment. Our study also indicated that optimal growth can be obtained using high irrigation and limited fertilization underlining the importance of optimal moisture for enhanced uptake. Fertilization is several folds more expensive than irrigation; therefore, any substantial reduction in fertilizer rate required for achieving optimal growth will result in substantial savings for growers and nursery managers. Increased resource availability also positively affected foliar nitrogen and phosphorus content. The strong foliar nutrient content response to fertilization suggests that nutrient addition is a strong determining factor for early development of this species. Our results also showed improved growth efficiency probably caused by one or any combination of factors including: improvements in the photosynthetic abilities, decrease in stomatal limitations, changes in resource allocation in favor of the stem, or increases in the ratio of photosynthesis to respiration. Further physiological studies are being conducted to confirm these hypotheses.
Acknowledgments
We gratefully acknowledge Petersons Riverview Nursery, Allegan, MI for donating the plant material used in this study. This study was partly funded by the Michigan State University Project GREEEN, and the Michigan Christmas Tree Association.
References
- Albaugh T.J., Allen H.L., Dougherty P.M. and Johnsen K.M., 2004. Long term growth responses of loblolly pine to optimal nutrient and water additions. For. Ecol. Manage. 192: 3–19. [CrossRef] [Google Scholar]
- Albaugh T.J., Allen H.L. and Fox T.R., 2008. Nutrient uptake in Pinus taeda. Tree Physiol. 28: 1083–1098. [PubMed] [Google Scholar]
- Bergh J., Linder S., Lundmarlk T. and Elfving B., 1999. The effect of water and nutrient availability on the productivity of Norway spruce in northern and southern Sweden. For. Ecol. Manage. 119: 51–62. [CrossRef] [Google Scholar]
- Bilderback T.E., 1999. Fertilizer choices and recommendations. Proc. of the NC State Nursery Short Course 1: 28–29. [Google Scholar]
- Brown K.R. and van den Driessche R., 2002. Growth and nutrition of hybrid poplars over 3 years after fertilization at planting. Can. J. For. Res. 32: 226–232. [CrossRef] [Google Scholar]
- Cobb W.R., Will R.E., Daniels R.F. and Jacobson M.A., 2008. Aboveground biomass and nitrogen in four short-rotation woody crop species growing with different water and nutrient availabilities. For. Ecol. Manage. 255: 4032–4039. [CrossRef] [Google Scholar]
- Coyle D.R. and Coleman M.D., 2005. Forest production responses to irrigation and fertilization are not explained by shifts in allocation. For. Ecol. Manage. 208: 137–152. [CrossRef] [Google Scholar]
- Coyle D.R., Coleman M.D. and Aubrey D.P., 2008. Above- and below-ground biomass accumulation, production, and distribution of sweetgum and loblolly pine grown with irrigation and fertilization. Can. J. For. Res. 38: 1335–1348. [CrossRef] [Google Scholar]
- Derby S.A. and Hinesley L.E., 2005. Growth of containerized Atlantic white cedar seedlings as affected by container volume, substrate, fertilizer, and irrigation. HortScience 40: 1755–1759. [Google Scholar]
- Grossnickle S.C., 2000. Ecophysiology of northern spruce species. The performance of planted seedlings. NRC Research Press, Ottawa, Ontario, Canada, 409 p. [Google Scholar]
- Groves K.M., Warren S.L. and Bilderback T.E., 1998. Irrigation volume application, and controlled-release fertilizers: effect on plant growth and mineral nutrient content in containerized plant production. J. Environ. Hort. 16: 176–181. [Google Scholar]
- Hsiao T.C., 1973. Plant response to water stress. Ann. Rev. Plant Physiol. 24: 519–570. [CrossRef] [Google Scholar]
- Jokela E.J. and Martin T.A., 2000. Effect of ontogeny and soil nutrient supply on production and allocation, and leaf area efficiency in loblolly pine and slash pine stands. Can. J. For. Res. 30: 1511–1524. [CrossRef] [Google Scholar]
- Jonard M., Andre F., Dambrine E., Ponette Q. and Ulrich E., 2009. Temporal trends in the foliar nutritional status on the French, Walloon and Luxembourg broad-leaved plots of forest monitoring Ann. For. Sci. 66: 412. [CrossRef] [EDP Sciences] [Google Scholar]
- Landis T.D., 1989. Mineral nutrients and fertitilization. In: Landis, T.D., Tinus, R.W., McDonald, S.E., Barnett, J.P. (Eds.), The container Tree Nursery Manual, Seedlings Nutrition and Irrigation Vol. 4. USDA Forest Service Agricultural Handbook 674, Washington, DC, pp. 1–67. [Google Scholar]
- Malik V. and Timmer V.R., 1998. Biomass partitioning and nitrogen retranslocation in black spruce seedlings on competitive mixed-wood sites: a bioassay study. Can. J. For. Res. 28: 206–215. [CrossRef] [Google Scholar]
- Marschner H. 1986. Mineral nutrition in higher plants. Academic Press, New York, 674 p. [Google Scholar]
- McAlister J.A. and Timmer V.R., 1998. Nutrient enrichment of white spruce seedlings during nursery culture and initial plantation establishment. Tree Physiol. 18: 195–202. [PubMed] [Google Scholar]
- McDonald S.E., 1984. Irrigation in forest-tree nurseries: monitoring and effects on seedling growth. In: Durya, M.L. and Landis T.D. (Eds.), Forest Nursery Manual: Production of Bareroot Seedlings: Martinus Nijhoff/Dr W. Junk Publisher, The Hague/Boston/Lancaster, for Forest Research Laboratory, Oregon State University. Corvallis, OR, 386 p. [Google Scholar]
- Myers R.H. and Montgomery D.C., 1995. Response surface methodology: process and product optimization using designed experiments. A Wiley-Interscience Publication, John Wiley & Sons, Inc., New York, New York, 700 p. [Google Scholar]
- Miller B.D. and Timmer V.R., 1994. Steady-state nutrition of Pinus resinosa seedlings: response to nutrient loading, irrigation and hardening regimes. Tree Physiol. 14: 1327–1338. [PubMed] [Google Scholar]
- Nilsson U. and Orlander G., 2003. Response of newly planted Norway spruce seedlings to fertilization, irrigation and herbicide treatments. Ann. For. Sci. 60: 637–643. [CrossRef] [EDP Sciences] [Google Scholar]
- Oliet J.A., Planelles R., Segura M.L. and Jacobs D.F., 2004. Mineral nutrition of containerized Pinus halepensis seedlings under controlled-release fertilizer. Scientia Hort. 103: 113–129. [CrossRef] [Google Scholar]
- Oliet J.A., Planelles R., Artero F. and Jacobs D.F., 2005. Nursery fertilization and tree shelters affect long-term field response of Acacia salicina Lindl. planted in Mediterranean semiarid conditions. For. Ecol. Manage. 215: 339–351. [CrossRef] [Google Scholar]
- Samuelson L.J., Butnor J., Maier C., Stokes T.A., Johnsen K. and Kane M., 2008. Growth and physiology of loblolly pine in response to long-term resource management: defining growth potential in the southern United States. Can. J. For. Res. 38: 721–732. [CrossRef] [Google Scholar]
- Sands G.H. and Mulligan D.R., 1990. Water and nutrient dynamics and tree growth. For. Ecol. Manage. 30: 91–111. [CrossRef] [Google Scholar]
- Sheriff D.W., Nambiar E.K.S. and Fife D.N., 1986. Relationships between nutrient status, carbon assimilation and water use efficiency in Pinus radiata (D. Don) needles. Tree Physiol. 2: 73–88. [Google Scholar]
- Snowdon P. and Benson M.L., 1992. Effect of the combination of irrigation and fertilization on the growth and above-ground biomass production of Pinus radiata. For. Ecol. Manage. 52: 87–116. [CrossRef] [Google Scholar]
- Tilt K.M., Bilderback T.E. and Fonteno W.C., 1987. Particle-size and container size effects on growth of 3 ornamental species. J. Am. Soc. Hort. Sci. 112: 981–984. [Google Scholar]
- Trichet P., Loustau D., Lambrot C. and Linder S., 2008. Manipulating nutrient and water availability in a maritime pine plantation: effect on growth, production and biomass allocation at canopy closure. Ann. For. Sci. 65: 814–826. [CrossRef] [EDP Sciences] [Google Scholar]
- USDA 2007. Floriculture and Nursery Crops Yearbook 2007. Market and Trade Economics Division, USDA Economic Research Service, Report FLO-2007, 139 p. [Google Scholar]
- van den Driessche R., Rude W. and Martens L., 2003. Effect of fertilization and irrigation on growth of aspen (Populus tremuloides Michx.) seedlings over three seasons. For. Ecol. Manage. 186: 381–389. [CrossRef] [Google Scholar]
- Xu X. and Timmer V.R., 1999. Growth and nitrogen nutrition of Chinese fir seedlings exposed to nutrient loading and fertilization. Plant Soil 216: 83–91. [CrossRef] [Google Scholar]
- Walker R.F., 2001. Growth and nutritional responses of containerized sugar and Jeffrey pine seedlings to controlled release fertilization and induced mycorrhization. For. Ecol. Manage. 149: 163–179. [CrossRef] [Google Scholar]
- Will R.E., Munger G.T., Zhang Y. and Borders B.E., 2002. Effects of annual fertilization and complete competition control on current annual increment, foliar development, and growth efficiency of different aged Pinus taeda stands. Can. J. For. Res. 2: 1728–1740. [CrossRef] [Google Scholar]
- Worrall R.J., Lamont G.P., O’Connell M.A. and Nicholls P.J., 1987. The growth response of container-grown woody ornamentals to controlled release fertilizers. Scientia Hort. 32: 275–286. [CrossRef] [Google Scholar]
All Tables
Statistical significance levels (ANOVA) of Fraser fir response variables after 2 y treatment with various irrigation and fertilization treatments.
Numerical optimization settings and results for annual height growth response variable.
Numerical optimization settings and results for the 2007 foliar nitrogen content.
All Figures
|
Figure 1 Stem water potential of as response to irrigation treatment. The graph indicate that plants irrigated at 3.75 and 2.50 cm/wk were exposed to similar water stresses while 1.25 cm/wk and 0.625 cm/wk were exposed to higher water stress levels. The data was analyzed by repeated measures ANOVA and was highly significant at P = 0.000 with α = 0.01. |
| In the text | |
|
Figure 2 Height (A) and diameter (B) growth as response to irrigation and fertilization treatments. The cummulative growth indicates a linear response to irrigation. |
| In the text | |
|
Figure 3 Allocation of biomass accumulation as affected by irrigation (IRR) and fertilization treatments. |
| In the text | |
|
Figure 4 Growth efficiency calculated as the ratio of stem to foliage biomass accumulation as affected by irrigation and fertilization treatments. |
| In the text | |